
Mr. Chartist- Learn Today For Better Tomorrow
2.6K subscribers
About Mr. Chartist- Learn Today For Better Tomorrow
SEBI Registered ®️ Reasearch Analyst
Similar Channels

Learn PowerBI From Scratch

Traderivative

Technology 🤖 • Facts 💯 & Mysteries🕵♂️
Amit Option Learning

Learn English
LEARN WITH US

Pratik_SmartEye
Duhan TRADERS HUB ,✅✅

30% club 💼

The Gracie Bon & Foxy Menagerie Music Box 🍑⏳💃🕺

Better Mindset

Learn With AZEEM SAFI

Kitchik Learning

Learn English | IELTS | Grammar | CSAT | UPSC| Spoken English | SSC Grammar |

Khula-Impact Markets
Swipe to see more
Posts
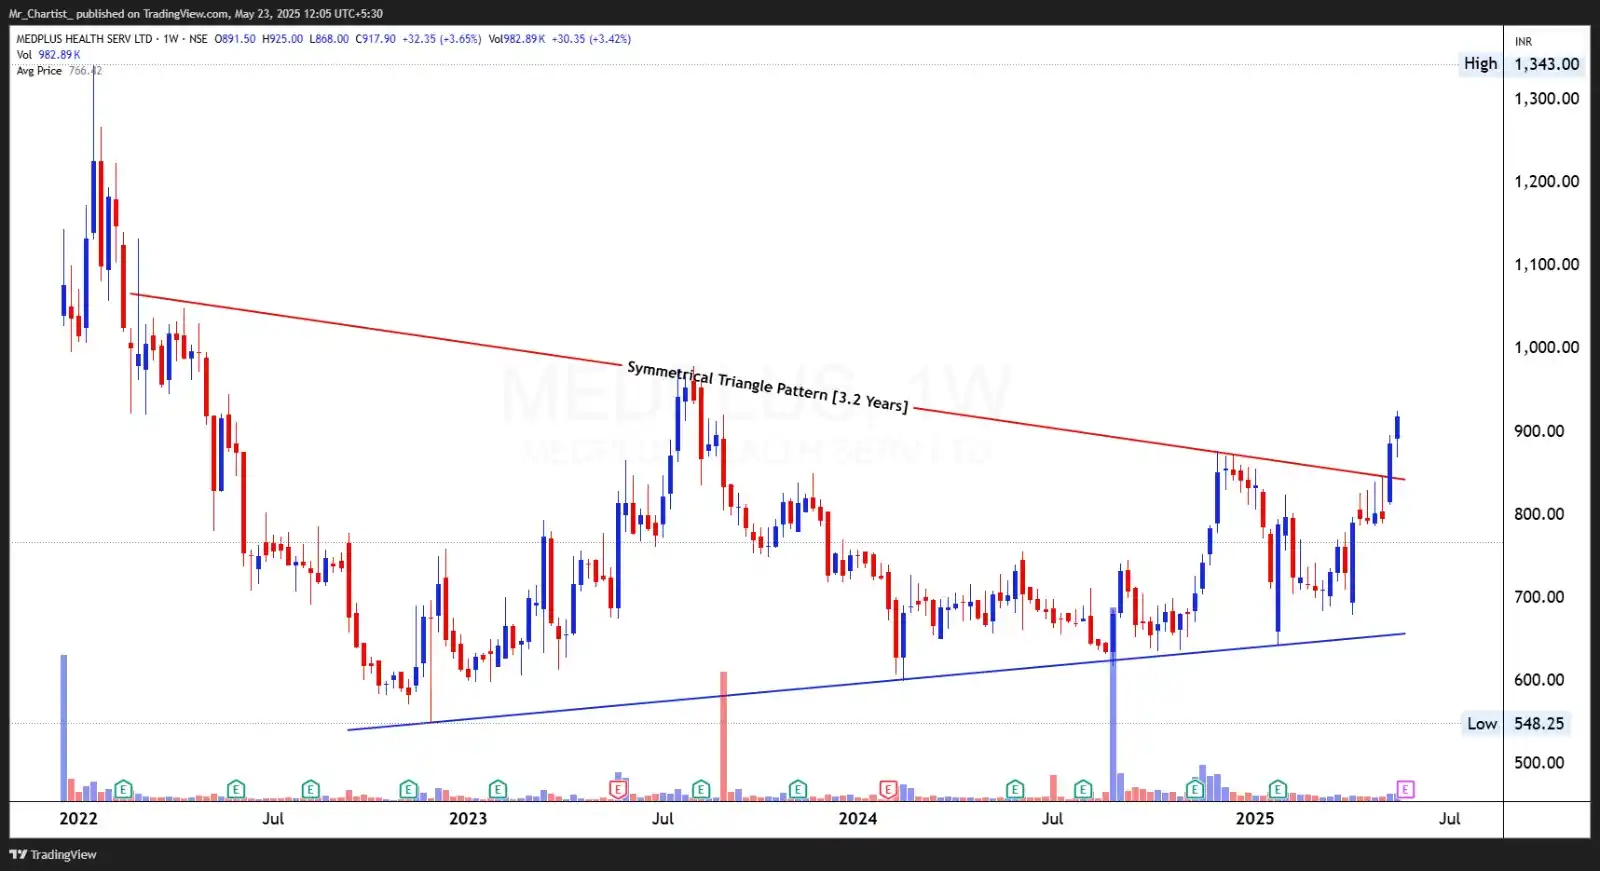
🚀 Breakout Stock Alert: MedPlus Health Services Ltd (MEDPLUS) 📌 Price: ₹917.90 📊 Volume: 982.89K 📅 Date: 23-05-2025 ① Pattern Name, Timeframe, Structure & Explanation Pattern: Symmetrical Triangle Timeframe: Weekly Chart Duration: \~3.2 Years (From early 2022 to May 2025) MedPlus has officially broken out of a massive 3.2-year Symmetrical Triangle on the weekly timeframe — a powerful long-term consolidation structure. This triangle was shaped by: * A series of lower highs capped by a descending resistance trendline from ₹1,300 * A base of higher lows rising from the ₹550–₹600 region * Price coiled within narrowing boundaries, signaling volatility contraction and balance between buyers and sellers The current breakout move is clear, decisive, and well-formed above the triangle’s resistance zone, marking a long-term trend reversal with significant upside potential. ② Volume Formation (During Pattern, Breakout, and Retest) * During the Triangle: Volume steadily declined over time — a textbook signature of consolidation * Breakout Candle (Current Week): Massive expansion in volume to nearly 1M shares, well above average — confirming strong institutional participation and conviction in the breakout * Retest Expectation: Any mild pullback toward ₹850–₹870 should ideally be on lower volume, creating a textbook bullish retest scenario ③ Breakout Candlestick, Follow-Through & Trap Behavior * Breakout Candle: Full-bodied bullish candle, closing near week’s high with strong upward thrust — clean structure and minimal upper wick * Follow-Through: Last few candles show consistent strength — a bullish progression after breakout confirms follow-through demand * Trap Behavior: None observed. No false breakouts or fake moves occurred in prior sessions. The triangle held strong with valid touches on both trendlines ④ Trade Explanation (Entry, Target, Stop-loss, Risk\:Reward) * Entry Zone: ₹910–₹940 (post-breakout or on minor dip) * Stop-loss: ₹830 (below breakout trendline and weekly support zone) * Target Zone: ₹1,100 (initial), ₹1,250–₹1,300 (long-term) 📏 *Measured Move Calculation:* Triangle range ≈ ₹1,300 – ₹550 = ₹750 Breakout from ₹900 gives potential to ₹900 + ₹750 = ₹1,650 (longer term) Risk\:Reward: Risk = ₹80 Reward = ₹190–₹400 R\:R = \~1:2.3 to 1:5 #Trading #Investing #Stocks #TechnicalAnalysis
https://x.com/Mr_Chartist/status/1926639795649794286


Homework📊 NSE:GATEWAY 66.77 01. Draw Support & Resistance 02. Read Volume 03. Read Gaps 04. Identify Candlestick Pattern and Impact 05. Analyse Pattern of Different time frame 06. Find Alert Point 07. Find Conclusion -Practice Makes Perfect #TechnicalAnalysis #TradingView
Homework📊 NSE:VRLLOG 628 01. Draw Support & Resistance 02. Read Volume 03. Read Gaps 04. Identify Candlestick Pattern and Impact 05. Analyse Pattern of Different time frame 06. Find Alert Point 07. Find Conclusion -Practice Makes Perfect #TechnicalAnalysis #TradingView
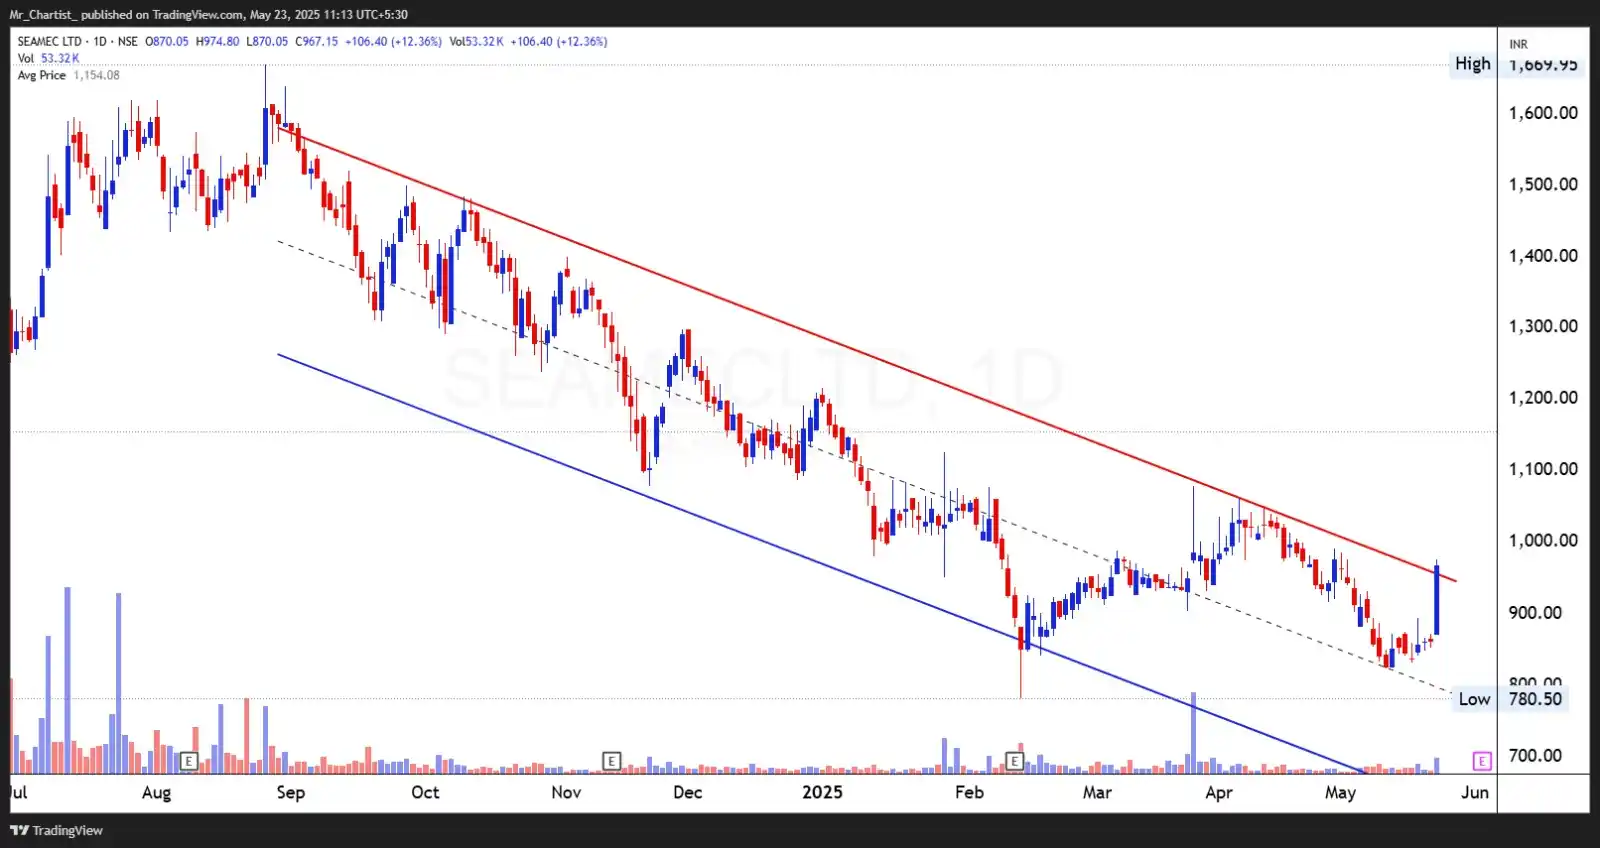
Homework📊 NSE:SEAMECLTD 944 01. Draw Support & Resistance 02. Read Volume 03. Read Gaps 04. Identify Candlestick Pattern and Impact 05. Analyse Pattern of Different time frame 06. Find Alert Point 07. Find Conclusion -Practice Makes Perfect #TechnicalAnalysis #TradingView