Super Performance
43 subscribers
About Super Performance
Super Performance: Your Gateway to Market-Beating Investments Unlock the power of superior stock selection and cutting-edge market insights with Super Performance. We're dedicated to identifying high-potential opportunities that outpace the market, focusing on:🔍 In-depth analysis of emerging market leaders 📈 Early spotting of multibagger stocks 💡 Exclusive investment ideas backed by thorough research 🏆 Strategies to maximize your portfolio performance 📈 Compounding Magic at 25% CAGR: 10 Years = 10x your capital 20 Years = 90x your capital 🔍 The Key: Find companies growing 20-25% over next decade Focus on proven execution & low-penetration sectors 💡 Remember: Consistent compounders > Short-term multibaggers Keep learning & improving your process
Similar Channels

Sharma Finserve Stock Market Special

Dèf Legacy

Opportunities 247
Data Science & Machine Learning

Stock Market Hawai Adda

Finance With Palak (Stock Market)📈

Skift Travel News

Dejavu Find

REAL ESTATE BIZ WITH #UjuRealEstate 🏠🏡

Limitless Trader (STOCKS AND INVESTMENT)

Canal 3 T.V. Biar

Ak Foundation Channel

🗽BUSINESS FIRST CLASS 📉🆓

WealthPro📈

Tech Sphere
Swipe to see more
Posts
📊 India's GDP Growth Analysis (2000–2024) 🔵 Congress Era (2000–2013): Average Growth: 7.14% Stability: Consistent and robust growth with minimal volatility. Peak Growth: 9.8% (2007). Lowest Growth: 3.9% (2008, global financial crisis). 🟠 BJP Era (2014–2024): Average Growth: 5.64% Volatility: Higher fluctuations due to events like demonetization, GST rollout, and COVID-19. Peak Growth: 8.9% (2021, post-pandemic recovery). Lowest Growth: -7.3% (2020, pandemic impact). 📈 Key Takeaway: Pre-2014 growth was stable and higher on average, while post-2014 growth saw more volatility and a lower average rate. Feel free to share this!
📊 Budget 2025: Economic Impact Analysis Key Highlights: • Personal Income Tax (PIT) cut announced • Estimated tax revenue foregone: ₹1 Lakh crore • Significant boost to middle class disposable income Economic Projections for FY26: 1. Consumption Growth: • Base growth: 7.2% • Additional growth from PIT cut: 4.8% • Total projected growth: >10% 2. GDP Growth: • Base growth: 6.3% • Additional growth from PIT cut: 2.7% • Total projected growth: >8% Key Assumptions: • Middle class savings rate: 20% • Consumption multiplier: 5 • FY25 real consumption: ₹104 Lakh crore • FY25 real GDP: ₹185 Lakh crore Estimated Impact: • Increase in consumption: ₹5 Lakh crore • Boost to GDP: ₹5 Lakh crore These projections suggest significant economic stimulus from the PIT reforms, potentially driving substantial growth in both consumption and GDP for FY26. For a detailed breakdown of calculations and further analysis, please contact our economic research team. #Budget2025 #EconomicGrowth #FiscalPolicy
🚀 8 Powerful Investing Lessons from the Pros 📈 1️⃣ Market crashes are normal - embrace them! Even top investors face big losses but win long-term. Volatility = Opportunity. Stay invested! 2️⃣ Stocks don't go up in a straight line Big gains come in bursts. Patience is key. 3️⃣ The 10 best days make or break your portfolio Timing the market is a myth. Smart money stays in. 4️⃣ Stop hunting for multi-baggers Most "hot tips" are scams. Real investors analyze & adjust. 5️⃣ Stock prices ≠ Fundamentals Sentiment changes fast. Focus on company strength. 6️⃣ Top investors have multiple income streams Use business income to invest during dips! 7️⃣ Admit mistakes & adapt quickly Be flexible, review your thesis & adjust when needed. 8️⃣ Buy & Monitor - Not Buy & Forget Good investing = Buying, Monitoring & Rotating capital. 💡 Key Takeaways: Investing is simple, but not easy Stay invested, avoid noise & focus on fundamentals Volatility = Opportunity, NOT Fear! Which strategy resonates with you most? Let's discuss! 💬
Smart Property Investment Guide 🏠 Calculate your Rental Yield before investing! 📊 Formula: Rental Yield = (Annual Rent ÷ Property Price) × 100 Quick Guide: ✅ Above 5% = Excellent Investment ✅ 4-5% = Good Investment ✅ 3-4% = Average Returns ❌ Below 3% = Poor Returns Example: Property: ₹50 lakhs Monthly Rent: ₹25,000 Annual Rent: ₹3 lakhs Yield: (3L÷50L)×100 = 6% Result: Excellent Investment! ⭐ Pro Tip: Always aim for properties with 4%+ rental yield for better returns! 💰
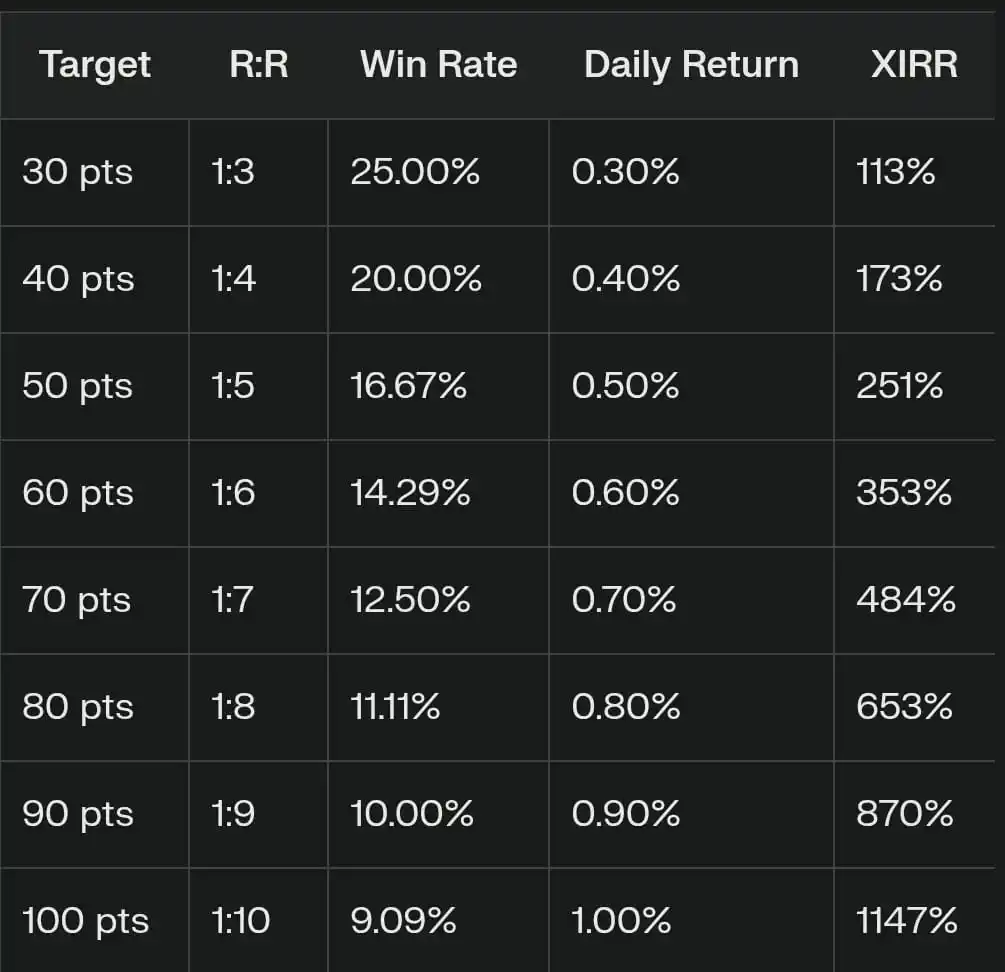
📱 Complete Strategy Analysis Capital: ₹1L Stop Loss: 10 points Time Period: 1 year (Feb 2025 - Feb 2026) Key Points: XIRR considers time value of money Higher targets show exponential XIRR growth Daily compounding effect reflected in XIRR Returns shown are pre-tax & costs Pro Tip: Start small, focus on consistency before scaling up targets! 📈 #TradingStrategy #XIRR #Compounding
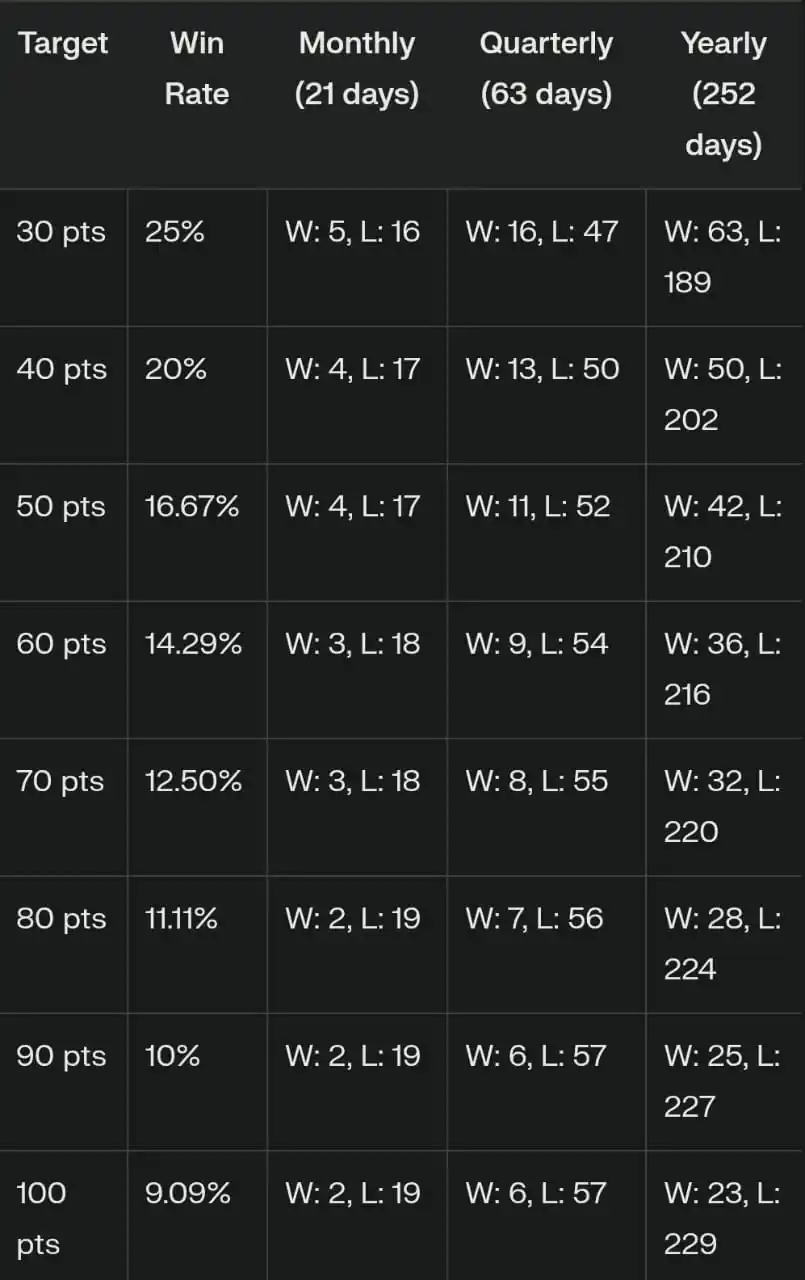
Key Insights: For 30 points target: Need only 5 winning days per month Can handle 16 losing days Yearly: 63 wins vs 189 losses still profitable! For 100 points target: Just 2 winning days per month Can handle 19 losing days Yearly: 23 wins vs 229 losses still profitable! Remember: Strict stop loss is crucial Higher targets = More losing days but bigger profits Psychological preparation for consecutive losses needed #TradingStrategy #WinRate #RiskManagement