
Tradeologist
55 subscribers
About Tradeologist
The Official Whatsapp Channel Of Share Market In Pak. Your Reliable Business Partner In The Forex Market #focused On Your Goals ⭕06 +Year Experience✨ ⭕️90 to 95% Above Accuracy(Win Rate)✨ ⭕️SMC structuring & ICT Model Expert✨ ⭕️Work On Liquidity Base✨ ⭕️ Fundamental analyst ✨
Similar Channels

The Yellow Pillow - Your Digital Marketing Partner
ONE MILLION DOLLAR GOAL FX

Lugastroy

Focusing Edu-Birds Official

Gold Expert

epic free forex signal

ONLINE BUSINESS WORKS..... AVAILABLE

NEO DESIGN MEDIA AND MARKETING (PTY) LTD

Eleições - Política com algo a mais

Forex Trading

CRYPTO HUB 💵⚖️
Rumah Film Indonesia

SellAnyBiz.Com Dealmakers Inner Circle Exclusive Off Market Business Listings , Weekly Newsletters

Iqbal | GWI | AI Marketing

Marketing Tips Zimbabwe
Swipe to see more
Posts
War and crypto headline Links https://t.me/WarCryptoHeadline

SMC (Smart Money Concepts) Structure Mapping in trading refers to analyzing price action to identify key market structures, liquidity zones, and institutional footprints. It helps traders understand where "smart money" (institutions, banks, and big players) is likely to be active. Key Components of SMC Structure Mapping: 1. Market Structure (MS) – Identifying trends (Bullish/Bearish) and structure shifts. Higher Highs (HH) & Higher Lows (HL) – Uptrend Lower Highs (LH) & Lower Lows (LL) – Downtrend Break of Structure (BOS) – Confirms trend continuation. Change of Character (ChoCh/CHoCH) – Indicates potential trend reversal. 2. Liquidity Zones – Areas where price is likely to be manipulated. Buy-side Liquidity (BSL) – Above resistance (stop-loss orders). Sell-side Liquidity (SSL) – Below support (stop-loss orders). 3. Order Blocks (OB) – Last bullish or bearish candle before a strong move. Bullish OB – Price likely to bounce up. Bearish OB – Price likely to drop. 4. Fair Value Gaps (FVGs) – Areas of price inefficiency where price might return. 5. Mitigation Zones – Where institutions re-enter positions after manipulation. How to Use SMC Structure Mapping in Trading? 1. Identify Market Structure: Look for HH-HL in uptrends or LH-LL in downtrends. 2. Mark Liquidity Zones: Spot areas where stop hunts may happen. 3. Find Order Blocks: Locate strong OBs for potential trade entries. 4. Watch for CHoCH & BOS: Determine trend continuation or reversal. 5. Use FVGs & Mitigation Levels: Predict price corrections and re-entries. Would you like a chart example or a deeper breakdown of any concept?
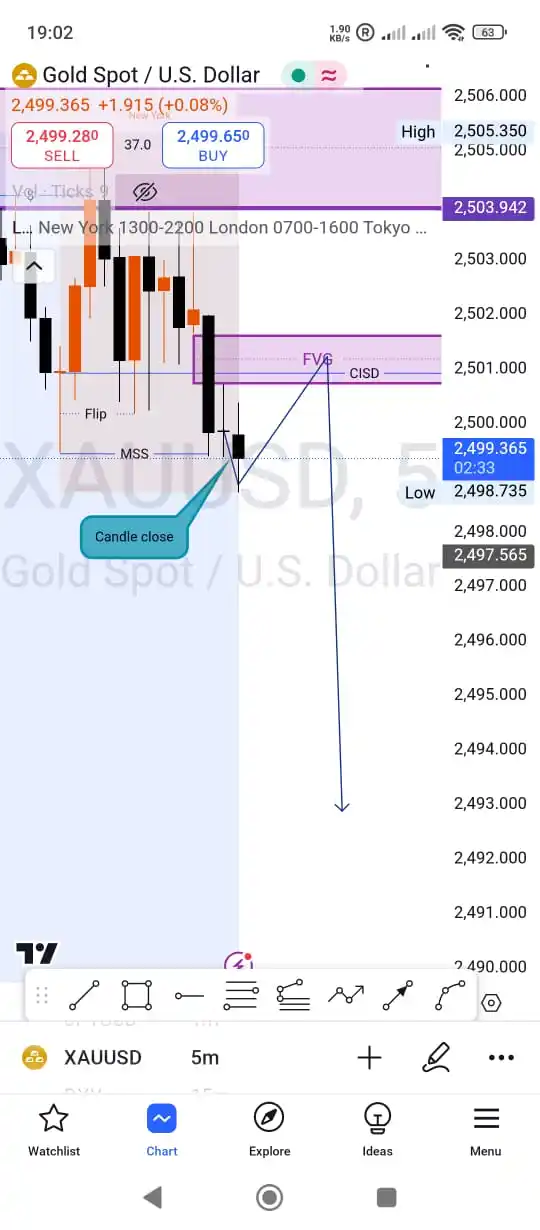
**ICT Entry Setup: Step-by-Step Guide** 1. **Market Structure Analysis** - **Identify a Market Structure Shift (MSS):** Look for a break of a prior swing high/low (bullish MSS) or swing low/high (bearish MSS). - **Example:** A bullish MSS occurs when price breaks above a previous swing high in a downtrend. 2. **Locate the Order Block (OB)** - **Definition:** An order block is a consolidation zone where institutional traders likely placed orders. - **Spot the OB:** Find it near the MSS break (e.g., a bearish OB forms as a consolidation candle *before* the MSS in a downtrend). 3. **Identify Liquidity Pools** - **Liquidity Targets:** Recent swing highs (for shorts) or swing lows (for longs) that price may target. - **Stop Hunts:** Price may briefly breach these levels to trigger stops before reversing. 4. **Check for Fair Value Gaps (FVGs)** - **FVGs as Acceleration Zones:** These are 3-candle imbalances where price may rapidly move toward liquidity. - **Use FVGs:** Enter trades when price retraces into an FVG aligned with your direction. 5. **Entry Confirmation** - **Price Reaction:** Wait for rejection signals at the OB (e.g., pin bar, engulfing candle, or divergence). - **Higher Timeframe Alignment:** Ensure the trend on the 4H/Daily chart supports your trade direction. 6. **Risk Management** - **Stop Loss:** Place stops beyond the OB or recent swing point (e.g., above a bearish OB for a short entry). - **Take Profit:** Target liquidity pools or FVGs. Use a 1:2+ risk-reward ratio. **Example Setup (Bullish):** - MSS: Price breaks a swing high in a downtrend. - OB: Bullish order block forms at the base of the break. - Liquidity: Target the swing high above. - FVG: Retracement into a bullish FVG near the OB. - Entry: Long on a bullish reversal candle at the OB. **Key Considerations** - **Confluence:** Higher probability if OB, FVG, and liquidity align. - **Avoid:** Premature entries without confirmation or ignoring higher timeframe trends. - **Timeframes:** Use 4H/Daily for direction, 15M/1H for entries. This framework balances price action, institutional order flow, and risk management per ICT methodology. Always validate with real-time price behavior.
The **ICT Acclamation Multiplication Distribution Method** in Forex, based on the teachings of Michael J. Huddleston (Inner Circle Trader), is a strategic approach to trading that aligns with institutional market phases. Here's a structured breakdown: ### 1. **Phases of the Method** - **Accumulation (Acclamation Phase)**: - **Identification**: Institutional traders build positions, often within a range or consolidation zone. Key tools include **order blocks**, support/resistance levels, and liquidity pools. - **Price Action**: Choppy, range-bound markets with false breakouts (liquidity grabs). - **Multiplication (Trend Phase)**: - **Entry & Scaling**: After a confirmed breakout (e.g., shift in market structure), traders enter and **add to positions** as momentum builds. Smaller timeframes refine entries. - **Indicators**: Strong directional candles, volume spikes, and breaks of key liquidity levels. - **Distribution (Exit Phase)**: - **Reversal Signals**: Institutions offload positions, marked by divergences, failed highs/lows, or reversal patterns (e.g., head-and-shoulders). - **Profit-Taking**: Gradual exit as distribution signs emerge, often near opposing liquidity zones. ### 2. **Key Tools & Concepts** - **Market Structure**: Break of structure (BOS) confirms phase transitions. - **Order Blocks**: Institutional entry/exit zones for accumulation/distribution. - **Liquidity Runs**: Price targets stops above/below key levels before reversing. - **Volume Analysis**: Confirms institutional participation during multiplication. ### 3. **Execution Steps** 1. **Identify Accumulation Zones**: Use higher timeframes (daily/weekly) to spot consolidation near order blocks. 2. **Confirm Breakout**: Wait for a BOS and retest of the accumulation zone. 3. **Enter & Multiply**: Start with a base position, add on pullbacks/retracements. 4. **Monitor Distribution**: Watch for weakening momentum (e.g., RSI divergence) or liquidity grabs. 5. **Exit Strategically**: Scale out of positions as distribution signals appear. ### 4. **Risk Management** - **Stop-Loss**: Place below/above accumulation zones to avoid fakeouts. - **Position Sizing**: Risk a fixed percentage per trade; avoid over-leverage when multiplying. - **Avoid Emotional Exits**: Follow predefined rules for scaling in/out. ### 5. **Example Scenario** - **EUR/USD Daily Chart**: - **Accumulation**: Price consolidates near a bullish order block at 1.0800. - **Multiplication**: Breaks 1.0850 with strong momentum; add positions on retracements to 1.0830. - **Distribution**: Fails to breach 1.1000 twice with RSI divergence; exit near 1.0950. ### Conclusion This method leverages institutional behavior to align with market phases, emphasizing disciplined entry/exit rules and risk management. While not explicitly named in ICT’s core materials, it synthesizes his principles of liquidity, order flow, and market structure. Always validate setups with multiple confluences.
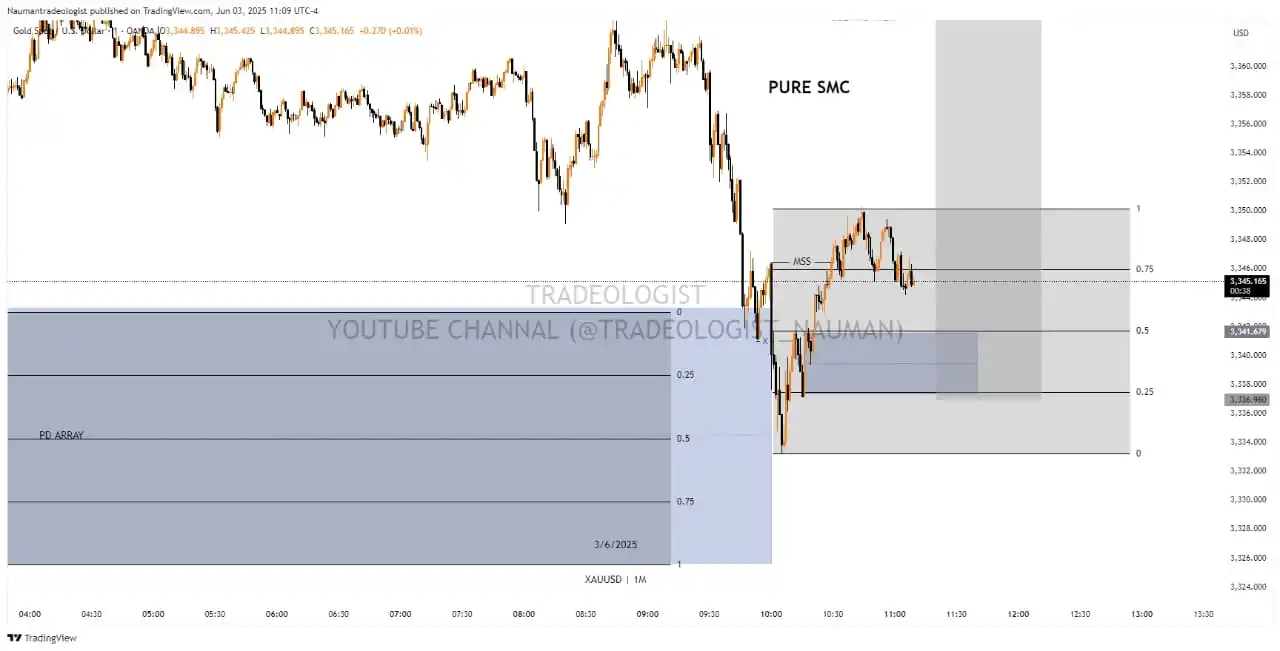
**SMC Structure Mapping in Trading Charts: A Comprehensive Overview** **Definition:** SMC (Smart Money Concepts) Structure Mapping is a technical analysis approach that identifies institutional (smart money) activities on price charts. It focuses on key levels and patterns where large market participants likely influence price movements, aiding traders in aligning their strategies with these forces. **Key Concepts:** 1. **Order Blocks:** - Zones where institutions place significant orders, acting as support/resistance. Bullish order blocks form during downtrends (accumulation), while bearish ones form during uptrends (distribution). 2. **Liquidity Pools:** - Areas with clustered stop losses or take profits. Price often targets these levels to "sweep" liquidity before reversing. 3. **Market Structure Shifts (MSS):** - Breaks of key highs/lows indicating trend changes. Example: A higher high in a downtrend suggests a potential reversal. 4. **Fair Value Gaps (FVGs):** - Imbalances from rapid price moves, often revisited to "fill" the gap. These can signal entry points if aligned with order blocks. 5. **Break of Structure (BOS) & Change of Character (CHOCH):** - **BOS:** Confirms trend continuation (e.g., new high in an uptrend). - **CHOCH:** Subtle momentum shifts, like a pullback failing to make a new extreme, hinting at trend weakness. **Steps for SMC Structure Mapping:** 1. **Identify Trend & Key Levels:** - Analyze higher timeframes (e.g., daily) to determine overall trend and major support/resistance levels. 2. **Mark Order Blocks & Liquidity Zones:** - Highlight areas where price reversed sharply (potential order blocks) and nearby liquidity pools. 3. **Detect Market Structure Shifts:** - Look for breaks of swing points (e.g., higher high in a downtrend) to confirm trend reversals. 4. **Spot FVGs and Retracements:** - Identify gaps from rapid moves and anticipate retracements to these levels, especially if they align with order blocks. 5. **Validate with BOS/CHOCH:** - Use BOS to confirm trend strength and CHOCH to spot early reversals. Combine with volume/price action for confirmation. **Examples:** - **Reversal Scenario:** In a downtrend, price forms a lower low followed by a higher high (MSS). A bullish order block at the prior low acts as support. A rejection candle (e.g., pin bar) here signals a long entry. - **FVG Fill:** A rapid rally leaves an FVG. Price retraces to fill the gap, coinciding with a bullish order block, offering a buying opportunity. **Considerations:** - **False Breakouts:** Use volume and candlestick patterns (e.g., wicks, closes beyond levels) to confirm MSS. - **Risk Management:** Place stop losses beyond liquidity zones and adhere to risk-reward ratios. - **Integration:** Combine SMC with other tools (e.g., RSI, volume profile) for robust analysis. **Conclusion:** SMC Structure Mapping provides a framework to decode institutional influence on price action. By systematically mapping order blocks, liquidity zones, and structural shifts, traders can anticipate potential market movements and align with smart money dynamics. Continuous practice and backtesting are essential to refine this approach.
ICT Silver Bullet --- ### **ICT Silver Bullet** The **Silver Bullet** is a specific trading strategy developed by Michael Huddleston (ICT) that focuses on capturing quick, high-probability price movements during the **London Open**. It is designed to take advantage of the increased liquidity and volatility that typically occurs during this time. --- ### **Key Components of the ICT Silver Bullet Strategy** 1. **Time Frame**: - The strategy is executed during the **London Open**, specifically between **2:00 AM and 5:00 AM EST**. - This is when institutional traders are most active, creating significant price movements. 2. **Market Structure**: - Traders analyze the **higher time frame (HTF)** market structure (e.g., 1-hour or 4-hour charts) to identify the overall trend and key levels of support and resistance. 3. **Liquidity Pools**: - Look for areas of liquidity (e.g., recent highs or lows) where institutional traders might target stop orders. - Price often moves toward these liquidity pools before reversing. 4. **Fair Value Gaps (FVGs)**: - Identify imbalances in price (Fair Value Gaps) that could act as support or resistance during the London Open. 5. **Optimal Trade Entry (OTE)**: - Use Fibonacci retracement levels (typically 62%) to identify pullback zones for high-probability entries. 6. **Entry and Exit Rules**: - **Entry**: Wait for price to reach the OTE zone or a key level of support/resistance, then enter in the direction of the trend. - **Stop Loss**: Place the stop loss below/above the recent swing low/high or outside the liquidity pool. - **Take Profit**: Target the next liquidity pool or a key level of resistance/support. --- ### **Step-by-Step Process for the ICT Silver Bullet** 1. **Prepare Before the London Open**: - Analyze the higher time frame (HTF) market structure to determine the overall trend (bullish or bearish). - Identify key levels of support and resistance, liquidity pools, and Fair Value Gaps. 2. **Wait for the London Open (2:00 AM - 5:00 AM EST)**: - Monitor price action during this time, as institutional activity increases. 3. **Look for a Displacement Move**: - A strong, impulsive price movement (displacement) often occurs during the London Open. - This move is typically caused by institutional orders. 4. **Identify the Pullback (OTE Zone)**: - After the displacement, wait for price to retrace to the Optimal Trade Entry (OTE) zone (e.g., 62% Fibonacci level). 5. **Enter the Trade**: - Enter a trade in the direction of the trend when price reaches the OTE zone and shows signs of reversal (e.g., candlestick patterns or momentum shift). 6. **Set Stop Loss and Take Profit**: - Place the stop loss below/above the recent swing low/high. - Take profit at the next liquidity pool or key level of resistance/support. 7. **Manage the Trade**: - Monitor the trade and adjust stop loss or take profit levels if necessary. --- ### **Example Scenario** - **Trend**: Bullish (based on HTF analysis). - **Liquidity Pool**: Recent high above a key resistance level. - **Displacement**: Price makes a strong upward move during the London Open. - **Pullback**: Price retraces to the 62% Fibonacci level (OTE zone). - **Entry**: Enter a buy trade at the OTE zone. - **Stop Loss**: Below the recent swing low. - **Take Profit**: At the next liquidity pool or resistance level. --- ### **Why the Silver Bullet Works** - The London Open is a high-liquidity, high-volatility period, making it ideal for capturing quick moves. - The strategy aligns with institutional order flow, increasing the probability of success. - It combines multiple ICT concepts (market structure, liquidity, OTE, and time-based analysis) into a single, focused strategy. --- ### **Important Notes** - The Silver Bullet requires discipline and patience. Not every London Open will provide a valid setup. - Always backtest the strategy on historical data and practice in a demo account before trading live. - Risk management is crucial—never risk more than you can afford to lose. Let me know if you'd like further clarification or examples! 😊