
Relitrade Group
229 subscribers
Verified ChannelAbout Relitrade Group
*Disclaimer:* This channel is created for educational purposes only. All posts here are intended for educational use. Please conduct your own research before trading or investing, or consult your financial advisor.
Similar Channels

The Trade Tick

TECHNICAL MALIK

Abdullah Ayubi

Türkiye İngilizce Öğretmenleri

🚩Learnings with Earnings | Indian Stock Market | Economic State & Predictions 2025

ذِكْر | Thikr 📖🌿..

THE INVESTMENT BLUEPRINT 📊🌐

SLOT INDONESIA 2025

🤑 Investment $ Trading 🤑

BEAST FOREX TRADING COMPANY 3
RGPV_Updates

Investment House 🎯

LEBRUN Fils combustible/ramonage

Share Market IPO
Only Educational
Swipe to see more
Posts
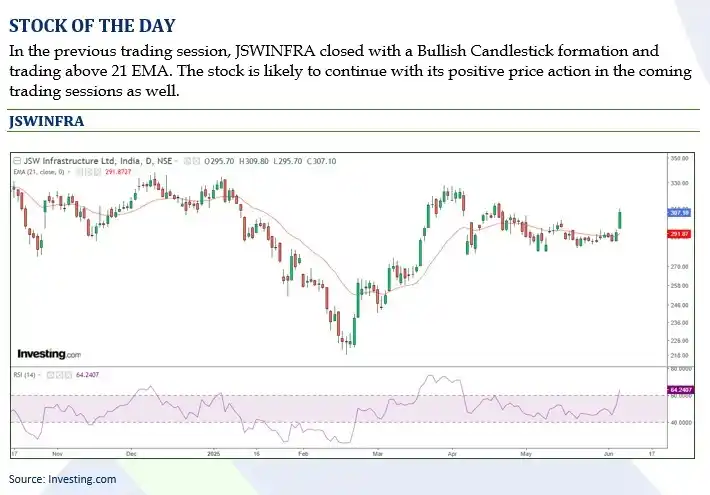


*MANAPPURAM CALL GIVEN ON 02nd JUN 2025* CMP: 245.80 Trail Target at 260 and also trail SL higher at 231
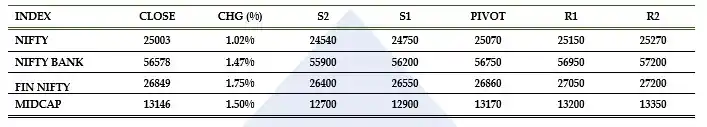
*DAILY EQUITY REPORT* *TECHNICAL OUTLOOK* The benchmark index traded on a positive note and closed with a 1.02% gain at the 25,003 level. The banking index outperformed the benchmark index as it closed with a 1.47% gain at the 56,578 level India VIX closed with 3.00% cut at 14.63 level Among sectors, REALTY and METAL outperformed the benchmark index as they closed with 4.68% and 1.90% gains, while DEFENCE and MEDIA were the laggards as they closed with 1.70% and 1.14% cuts respectively. The broader market had mixed results compared to the benchmark index, with the MIDCAP index outperforming and closing with a 1.50% gain, while the SMALLCAP index closed with a 0.81% gain. US markets, such as the DJIA traded with positive bias while European markets, including the DAX closed with mild negative sentiment in the previous trading session. Asian markets are trading with positive sentiment in today’s trading session *POSITIONAL MARKET OUTLOOK* The benchmark index traded with a positive bias and closed with Bullish candlestick formation during the previous week. Looking ahead, 24,400 will serve as a crucial support level, while 25,150 will act as immediate resistance for the index. The index is anticipated to continue trading with positive momentum and is expected to break out above the 25,150 level, which would confirm a breakout from the current consolidation pattern. It is recommended to maintain a long position, as any dip towards the 24,800 to 24,600 range should be viewed as a buying opportunity. A stop loss should be set at 24,300, and potential upward targets are projected to reach between 25,300 and 25,500 in the coming days. The banking index outperformed the benchmark index and closed with a Bullish candlestick pattern, suggesting strong development for the bulls. Looking ahead, the level of 55,000 will serve as crucial support for the index, while 57,600 will act as an immediate resistance level. The index has successfully maintained its position above the immediate resistance level of 56,100 by giving a daily close above this mark. It is recommended to maintain a positive outlook. Any dip towards the 56,000 – 55,600 range should be considered a buying opportunity. A stop loss can be set at 55,000, with the potential to target higher levels of 57,600 to 58,000. *INTRADAY MARKET OUTLOOK WITH CRUCIAL LEVELS* The benchmark index is expected to open higher and trade with positive sentiment in today’s trading session. The support level for the index is placed at 24,750 – 24,540, and resistance is positioned at 25,150 – 25,270 levels. The banking index is likely to trade in line with the benchmark index in today’s trading session. The support level is placed at the 56,200 – 55,900 level, and resistance at 56,950 – 57,200 level. *Disclaimer:* The above view is for educational purposes only. Trading carries significant risks and may not be suitable for all investors. Please conduct due diligence before investing, as past performance does not guarantee future results.

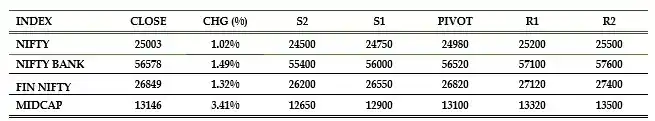
*WEEKLY EQUITY REPORT* *TECHNICAL OUTLOOK* Benchmark Index traded on a positive note during the previous week and closed with a 1.02% gain at 25,003 level. The banking index outperformed the benchmark index as it closed with 1.49% gain at 56,578 level Among the Nifty constituents, SHRIRAMFIN and DRREDDY closed with 7.65% and 5.57% gains while HDFCLIFE and TCS were the laggards as they closed with 2.80% and 2.29% cuts. Among the Bank nifty constituents, HDFCBANK outperformed the Banking index as it closed with 1.74% gain Among Sectors, REALTY and DEFENCE index outperformed the benchmark index as they closed with 9.51% and 2.69% gains, while MEDIA and IT were the laggards as they closed with 0.32% and 0.07% cut respectively. The broader market outperformed the benchmark index as both MIDCAP and SMALLCAP index closed with 3.41% and 3.91 gains respectively The volatility index (India VIX) closed with 9.00% cut at 14.63 level Globally, equity markets traded on a positive note during the previous week as the US market (DJIA) and the European market (DAX) closed with 1.17% and 1.28% gains respectively *POSITIONAL MARKET OUTLOOK* The benchmark index traded with a positive bias and closed with Bullish candlestick formation during the previous week. Looking ahead, 24,400 will serve as a crucial support level, while 25,150 will act as immediate resistance for the index. The index is anticipated to continue trading with positive momentum and is expected to break out above the 25,150 level, which would confirm a breakout from the current consolidation pattern. It is recommended to maintain a long position, as any dip towards the 24,800 to 24,600 range should be viewed as a buying opportunity. A stop loss should be set at 24,300, and potential upward targets are projected to reach between 25,300 and 25,500 in the coming days. The banking index outperformed the benchmark index and closed with a Bullish candlestick pattern, suggesting strong development for the bulls. Looking ahead, the level of 55,000 will serve as crucial support for the index, while 57,600 will act as an immediate resistance level. The index has successfully maintained its position above the immediate resistance level of 56,100 by giving a daily close above this mark. It is recommended to maintain a positive outlook. Any dip towards the 56,000 – 55,600 range should be considered a buying opportunity. A stop loss can be set at 55,000, with the potential to target higher levels of 57,600 to 58,000. *MARKET OUTLOOK FOR THE NEXT WEEK WITH CRUCIAL LEVELS* The benchmark index is expected to maintain its positive momentum for the upcoming week. Important support levels are placed at 24,750 – 24,500, and resistance levels at 25,200 – 25,500. The banking index is expected to trade in line with the benchmark index for the coming week. The support for the index is placed at 56,000 – 55,400, and resistance at 57,100 – 57,600 levels. *Disclaimer:* The above view is for educational purposes only. Trading carries significant risks and may not be suitable for all investors. Please conduct due diligence before investing, as past performance does not guarantee future results.