📊 Maan Stocks (Stock Market)
February 12, 2025 at 05:16 PM
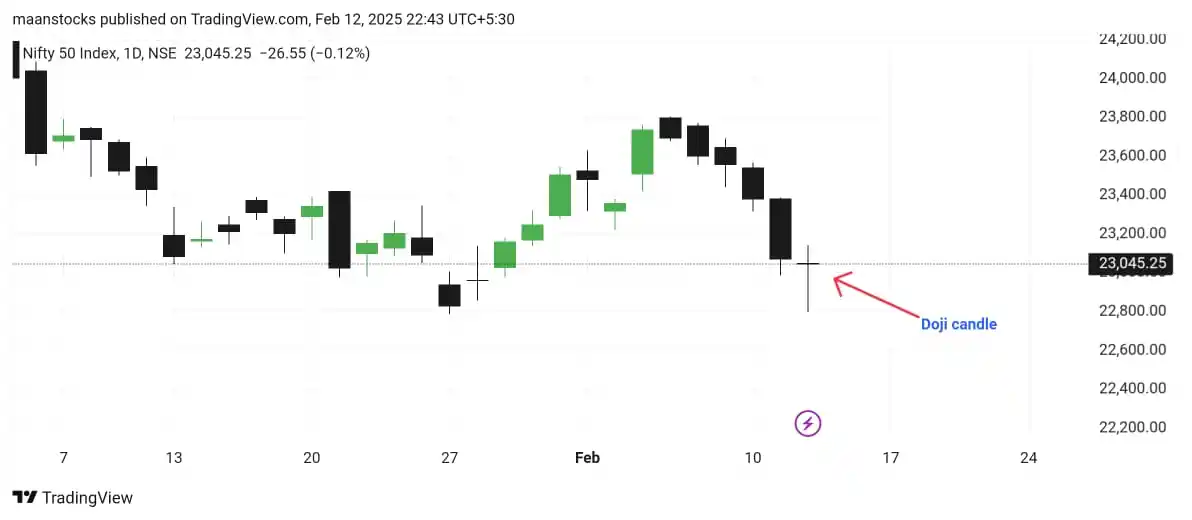
*Nifty 50 Chart Analysis*
1. Doji Candle at support, signaling indecision.
2. Downtrend before Doji, possible reversal or continuation.
3. Support: 22,900-23,000. Resistance: 23,300-23,400.
4. Bullish if price breaks above Doji’s high.
5. Bearish if price breaks below Doji’s low.
Confirmation needed! Watch next candle.