The Smart Analyst global
May 29, 2025 at 01:34 AM
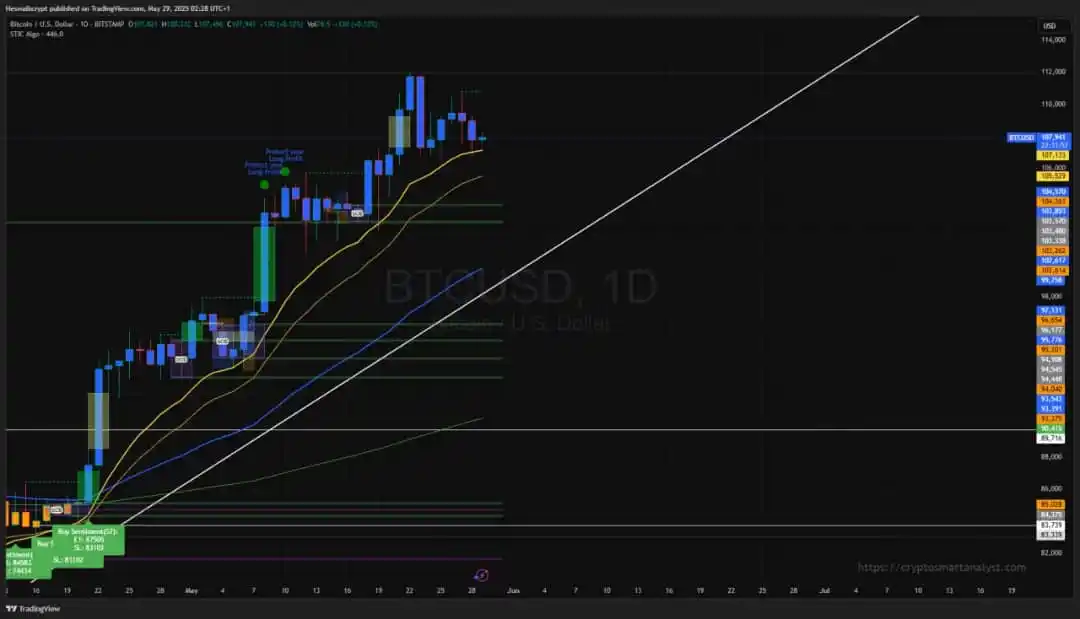
#btcusdt The green line represent bullish liquidity zone that has a potential of getting filled. if you are positioning for a rebuy, the region is a good position
chart.
region: 104k, 103k 96-92k,