
TheChartMaven
106 subscribers
About TheChartMaven
Hello Everyone, Welcome to TheChartMaven - Swing Traders! We're dedicated to providing in-depth stock market technical analysis solely for educational and paper trading purposes. Our mission is to offer you effective strategies for Swing Trading, Breakout Trading, and Momentum Burst Trading, along with the latest stock market news, Fundamental and Technical Analysis, and insightful stock market charts. Our goal is to help you sharpen your knowledge and enhance your paper trading skills. Visit: https://thechartmaven.com YouTube: https://www.youtube.com/@TheChartMaven For any questions or inquiries, feel free to reach out to us at [email protected]. Thank you for being a valuable part of our community! Best regards, Team TheChartMaven
Similar Channels

The Art Connect

Tsa Trasimeno servizi ambientali

The Trader’s Path

Percha News

Alexahire

Skynut

Madrygal Ciberseguridad

ABE
BEST CASINO CRYPTO ONLINE POLARLUCK

Redzing Radio

ZION CRYPTO HUB 💥🤑✅🔥

Stocks Pe Charcha by CA Ankit Agarwal

PORTAL INFO BANTUAN KERAJAAN B40 & M40

*TATTVA Realty & Infra - Leading Real Estate Investment Destination*

💕💕RomaShopy💕💕
Swipe to see more
Posts
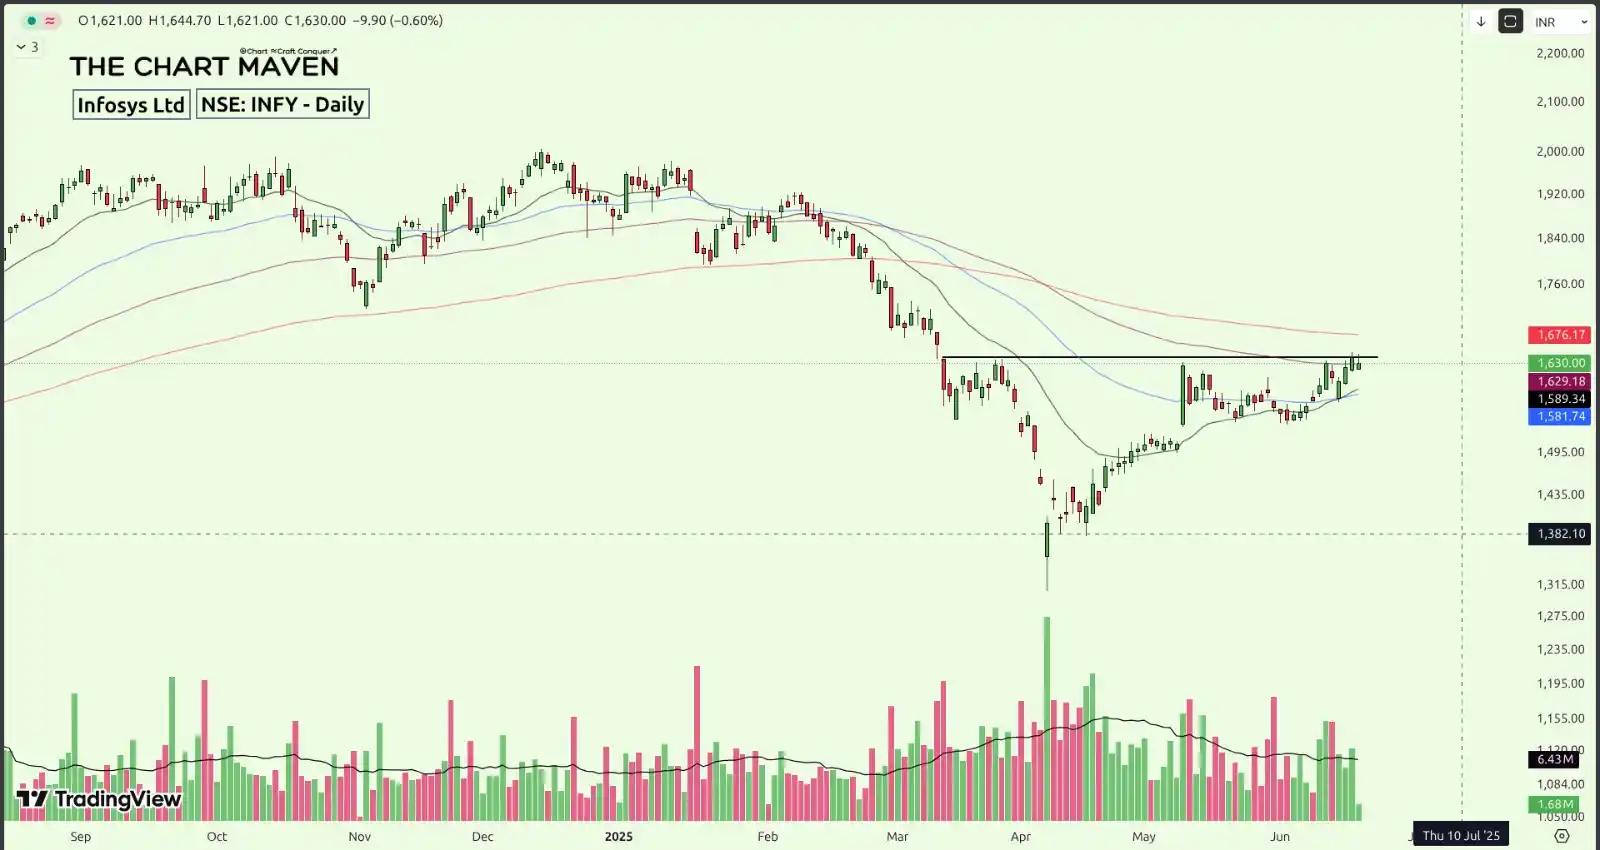
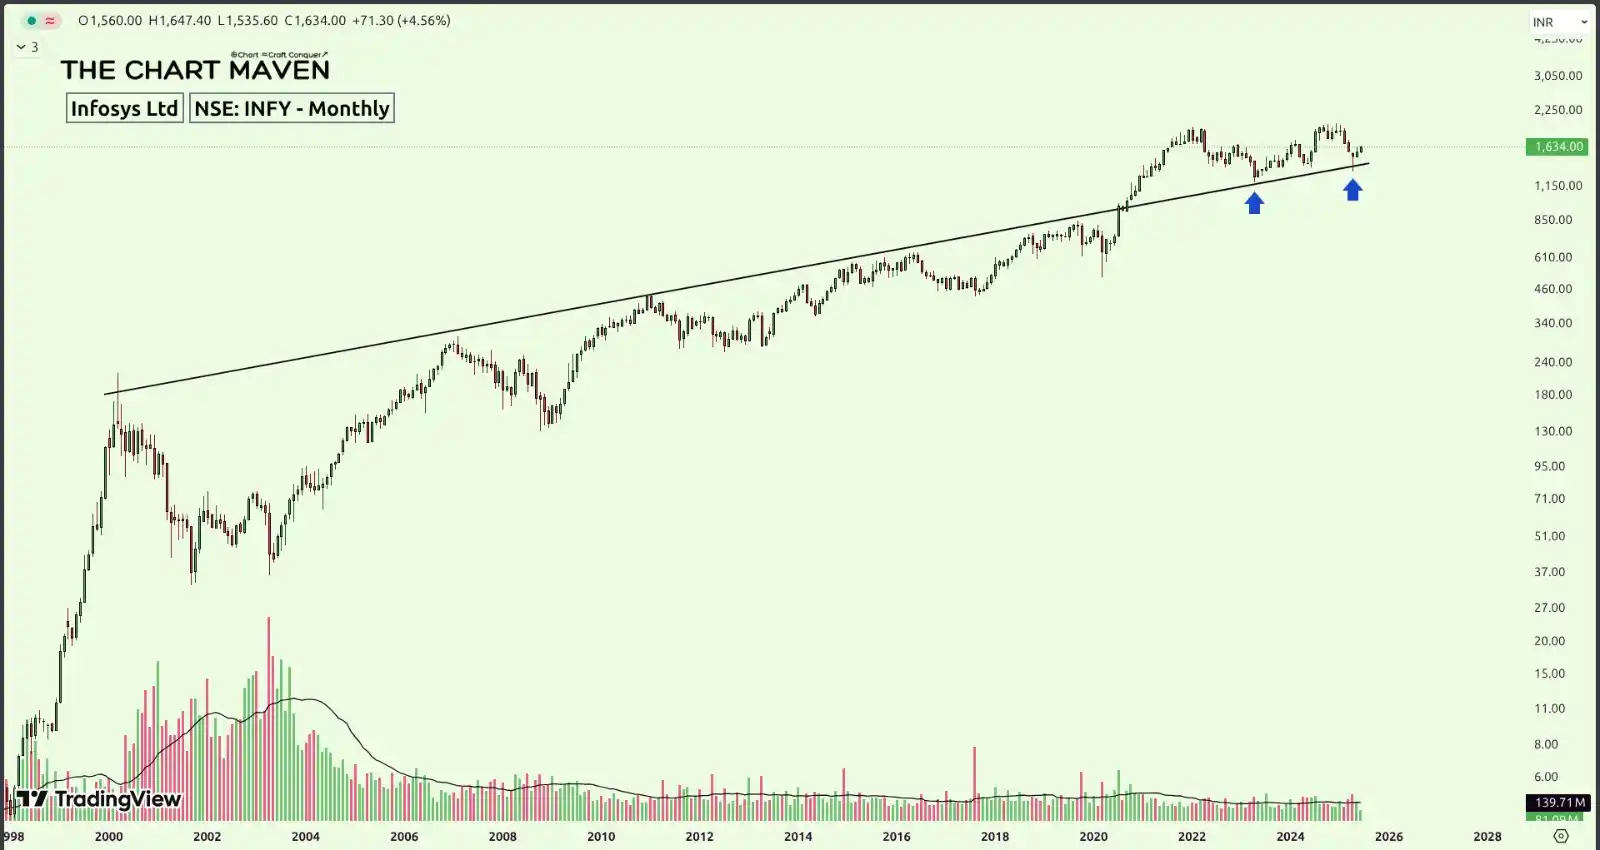
Infosys Ltd (INFY) – Monthly & Daily Charts We've already shared the monthly chart for a long-term perspective — the stock continues to hold strong, having once again taken support above the former long-term ascending trendline resistance. On the daily chart, INFY is setting up well near a key horizontal resistance zone, trading above both the 10 and 20 EMAs — a sign of strength and potential continuation.
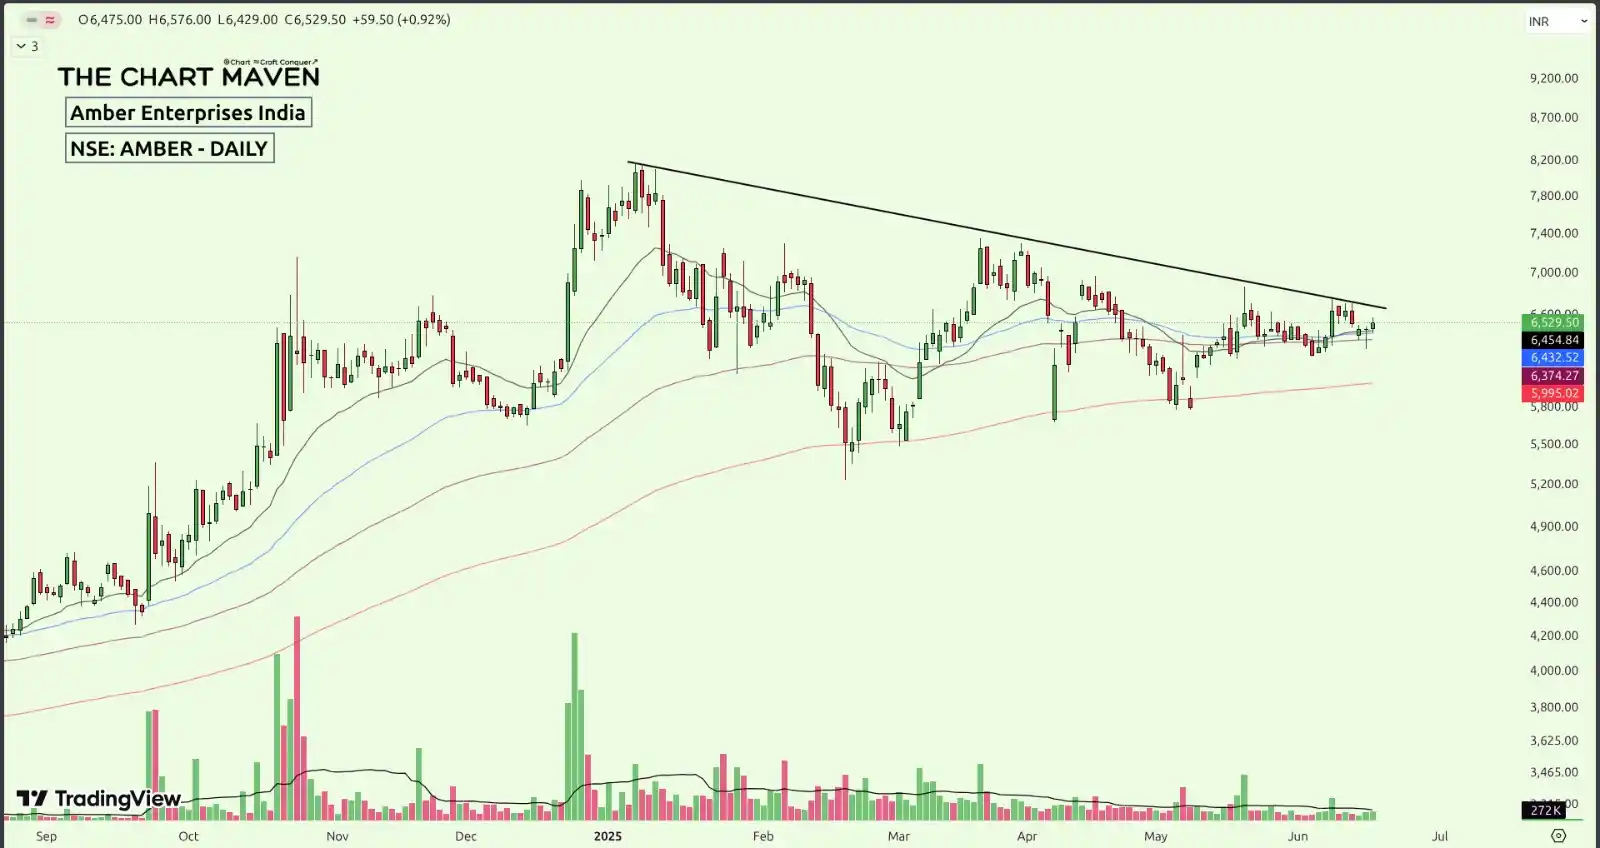
Amber Enterprises India Ltd (AMBER) – Daily Chart Setting up nicely with price holding above key EMA levels. A breakout above the descending trendline is underway, presenting a low-risk, high-reward setup.
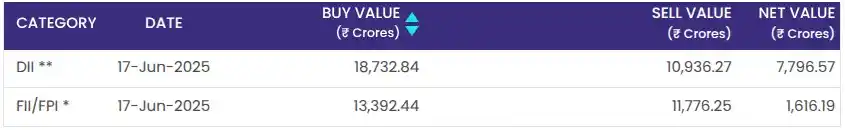
Today's DII & FII Net Activity: 17-Jun-2025 - DII: Net Buy 🟢 of ₹ 7,796.57 Cr - FII: Net Buy 🟢 of ₹ 1,616.19 Cr
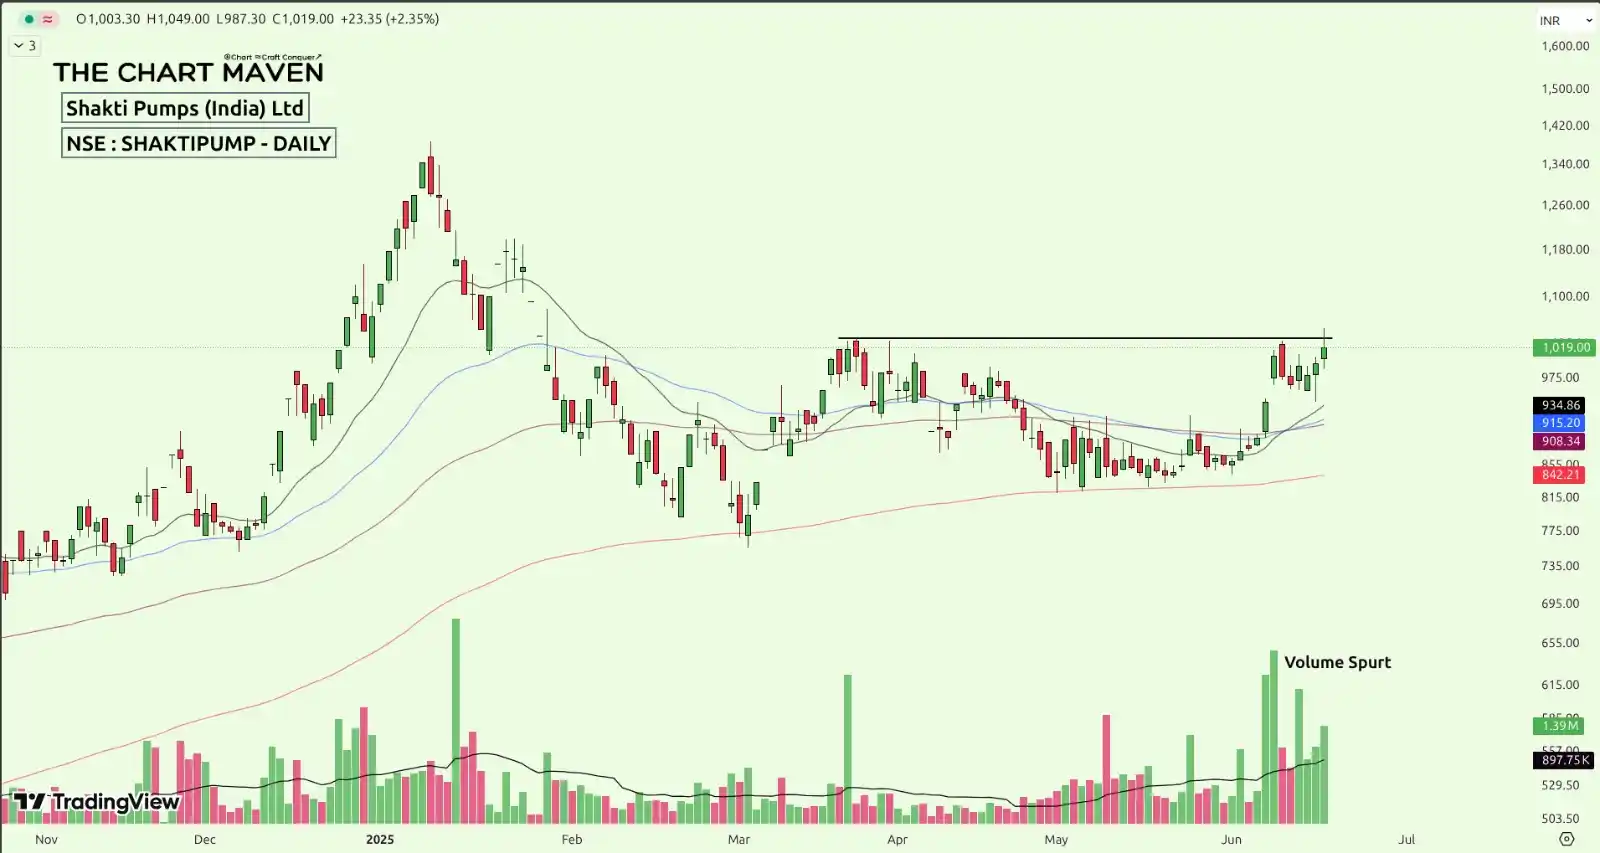
Shakti Pumps (India) Ltd (SHAKTIPUMP) – Daily Chart A breakout is in progress — a strong close above the trendline could confirm it. The stock is holding firm above all key EMA levels, signaling underlying strength.
*Ashapura Minechem - ASHAPURMIN* A challenging phase for this multi-year breakout candidate from the steel and mining sector. The sector is under pressure following recent news from the U.S.—Trump's plan to impose a 25% tariff on steel and aluminum imports.
Only a few stocks in my scan are holding above the 50 EMA, but I won’t be sharing charts for now. I’ll consider posting an analysis once Nifty breaks the LH-LL pattern. For now, the only standout leader is Greaves Cotton.
The trade war between the U.S. and China doesn’t seem to be ending anytime soon. As investors, what can we do? Focus on sectors that could benefit in the long run from this global shift. For example, take a closer look at *Pharmaceuticals* and *Electronics & Appliances*—they might present interesting opportunities.
Today's DII & FII Net Activity: 4-February-2025 - DII: Net Sale 🔴 of ₹ 430.70 Cr - FII: Net Buy 🟢 of ₹ 809.23 Cr
Today's DII & FII Net Activity: 11-February-2025 - DII: Net Buy 🟢 of ₹ 4,001.89 Cr - FII: Net Sale 🔴 of ₹ 4,486.41 Cr