TheChartMaven
June 18, 2025 at 05:08 AM
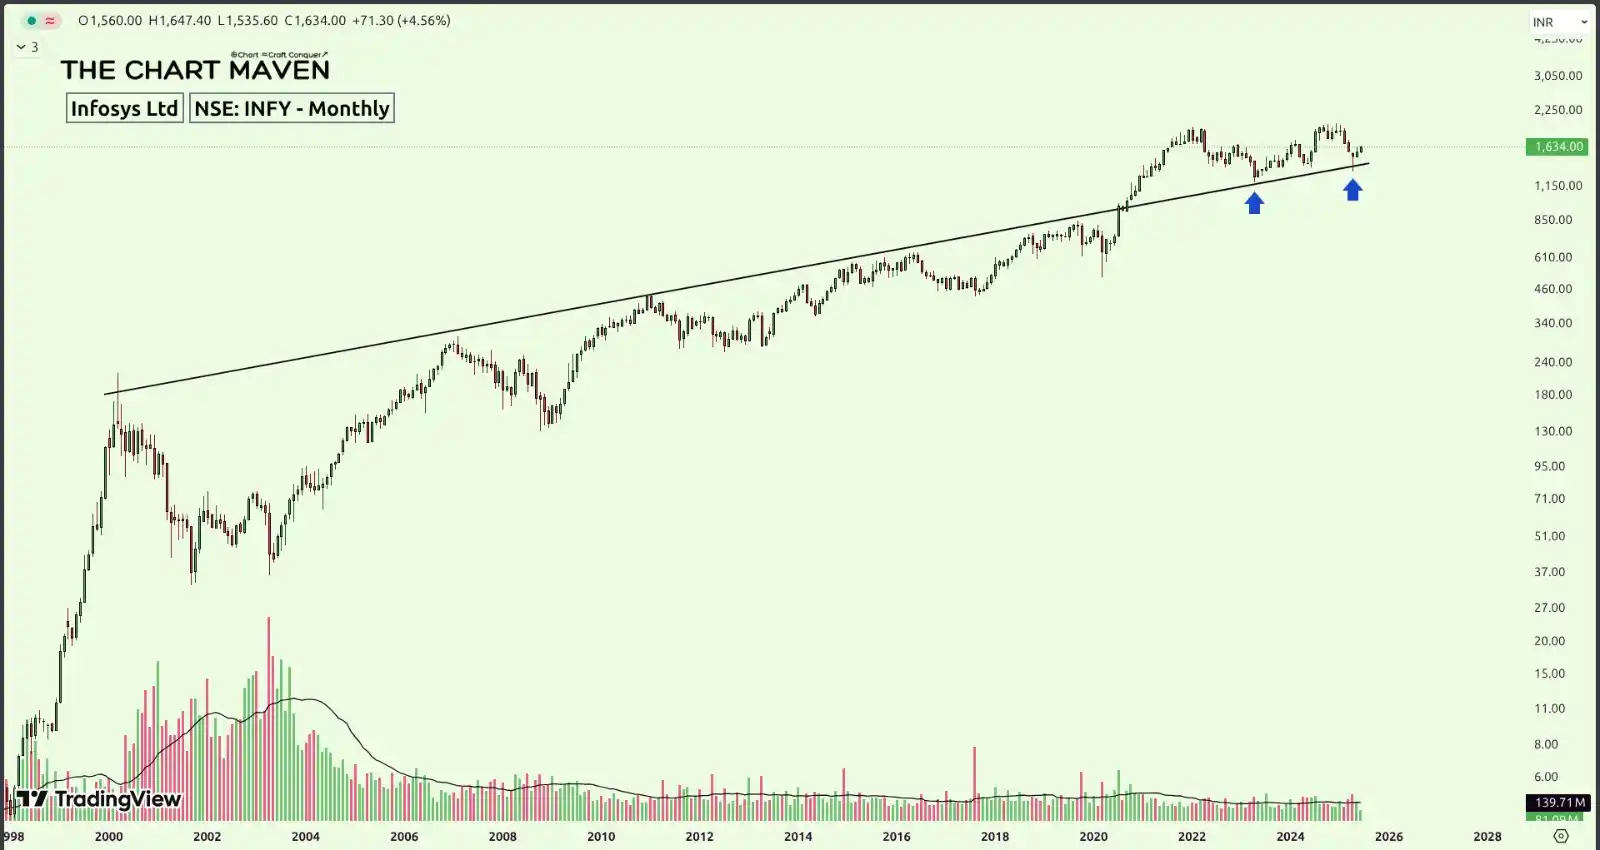
Infosys Ltd (INFY) – Monthly & Daily Charts
We've already shared the monthly chart for a long-term perspective — the stock continues to hold strong, having once again taken support above the former long-term ascending trendline resistance.
On the daily chart, INFY is setting up well near a key horizontal resistance zone, trading above both the 10 and 20 EMAs — a sign of strength and potential continuation.