
Samasthiti Advisors
280 subscribers
About Samasthiti Advisors
Official channel of www.samasthiti.in Follow us for our insights and research on matters relating to personal finance. Let's uncomplicate investing! You can reach out to us at [email protected] For more, check out our blog at www.samasthiti.in/blog
Similar Channels

Knowledge Factory Official

Finance Kart

Baker Street Investing Tales

91CLUB VIP PREDICTION GROUP

Research Matters

Aprende Guitarra Flamenca 💚

Manthan Research & Advisory

3𝕯𝕰𝖓𝖙𝖎𝖙𝖞 Official

GATE Master Official

𝐓𝐄𝐒𝐓𝚰𝐌𝐎𝐍𝚰 𝐄𝐋𝐙𝐀𝐍𝚰𝐀 𝐒𝐓𝐎𝐑𝐄

DHS STOCK INVESTING

UMAHWAHIDA PALESTINE SUPPORT INITIATIVE

The Techno-Funda Investor
Personal Finance & Stock Market India

Globe Migrant
Swipe to see more
Posts
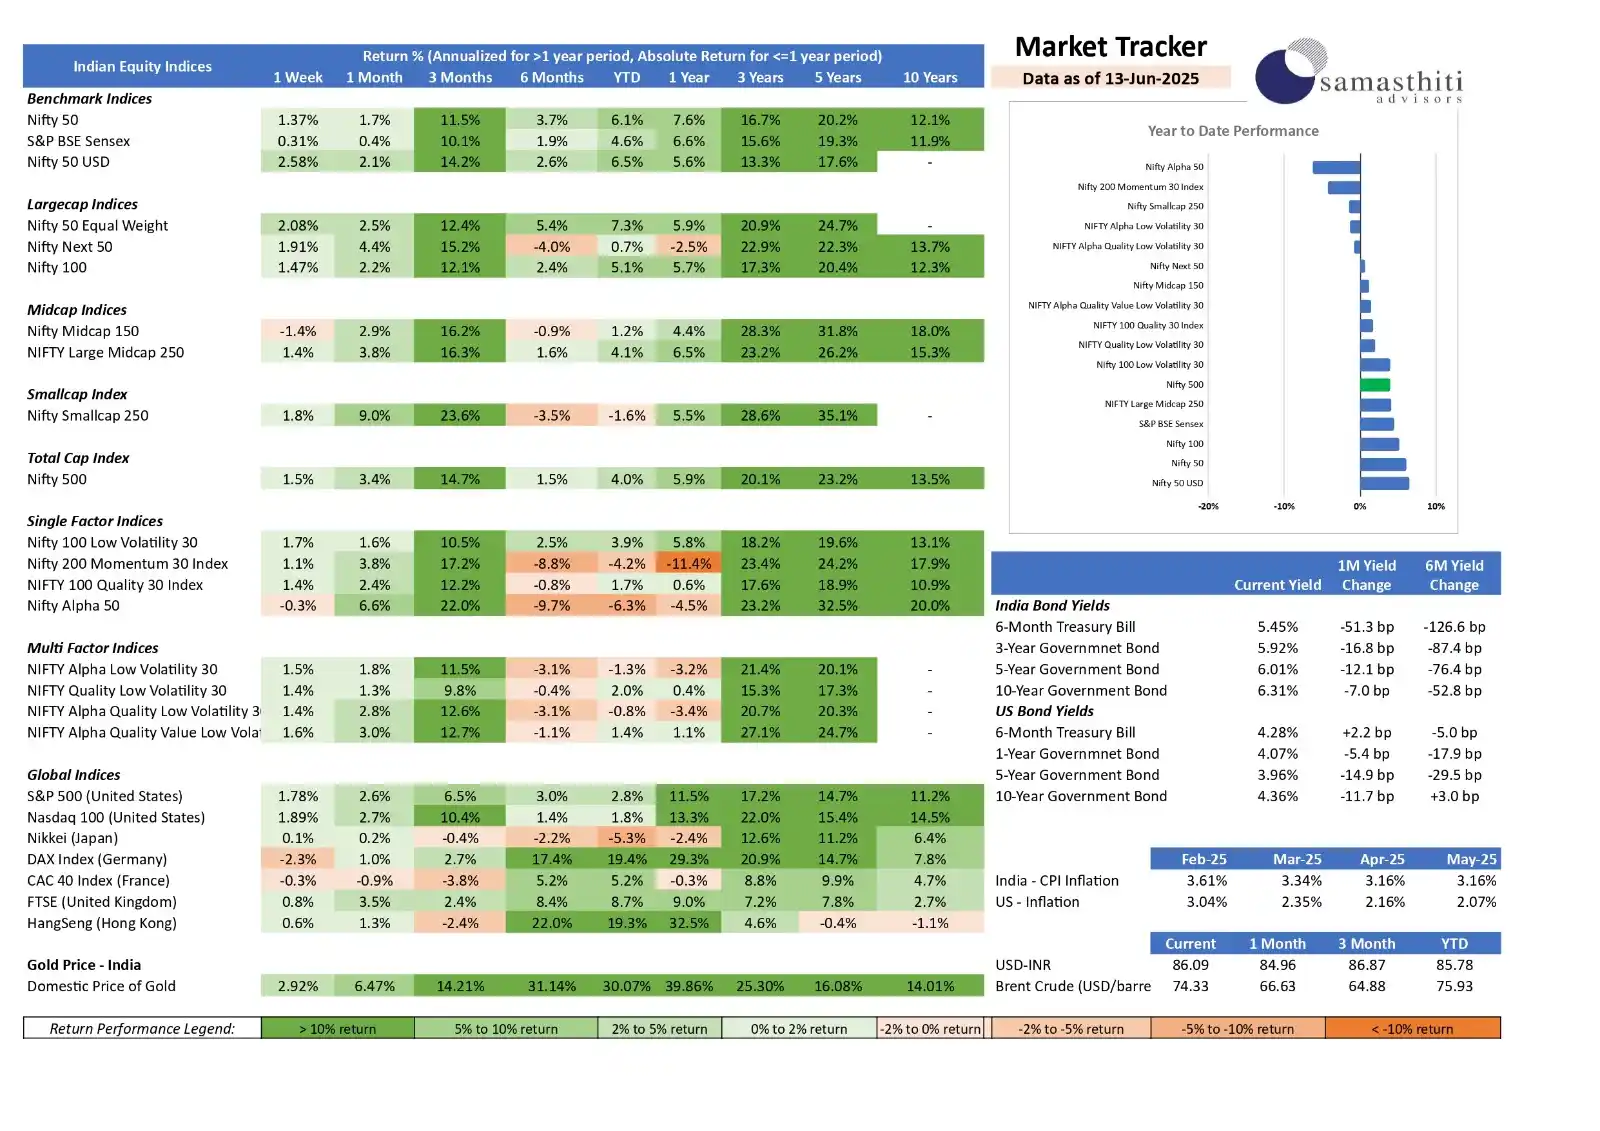
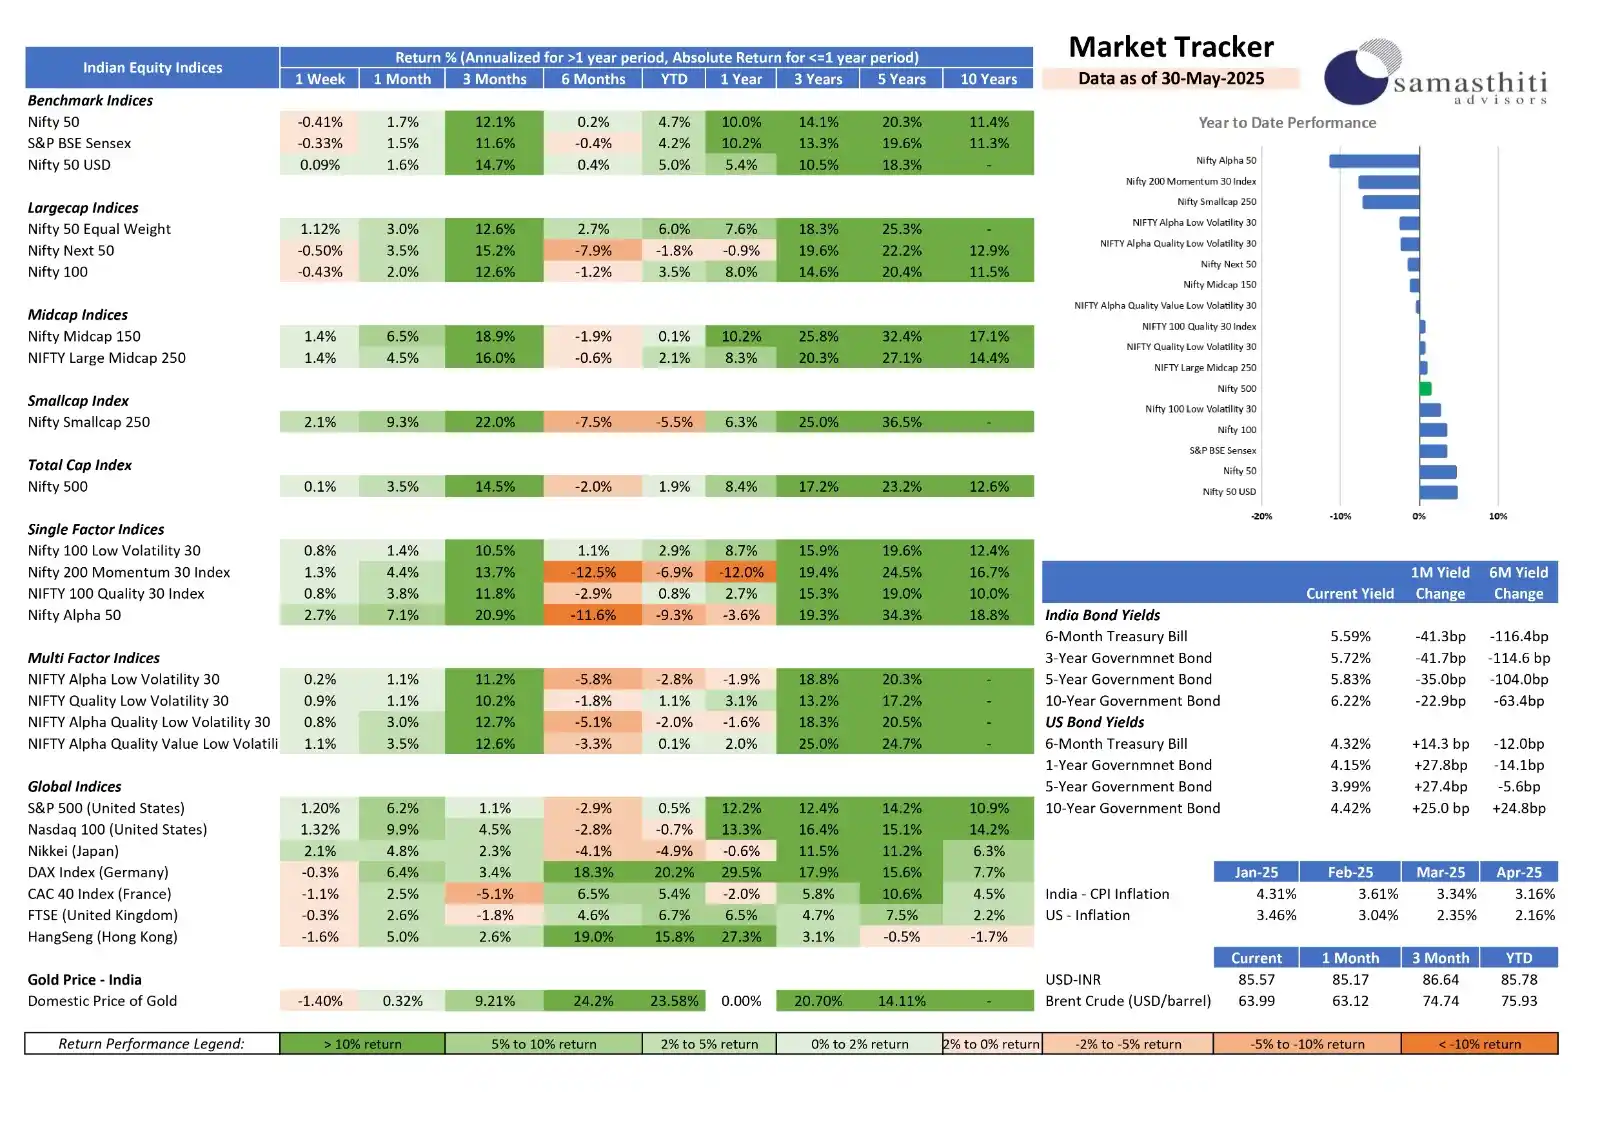
𝗦𝗮𝗺𝗮𝘀𝘁𝗵𝗶𝘁𝗶 𝗔𝗱𝘃𝗶𝘀𝗼𝗿’𝘀 𝗪𝗲𝗲𝗸𝗹𝘆 𝗠𝗮𝗿𝗸𝗲𝘁 𝗧𝗿𝗮𝗰𝗸𝗲𝗿 – 𝗙𝗼𝗿 𝘁𝗵𝗲 𝗪𝗲𝗲𝗸 𝗘𝗻𝗱𝗲𝗱 𝗠𝗮𝘆 𝟯𝟬, 𝟮𝟬𝟮𝟱 𝟭. 𝗜𝗻𝗱𝗶𝗮𝗻 𝗘𝗾𝘂𝗶𝘁𝗶𝗲𝘀: 𝗕𝗿𝗼𝗮𝗱-𝗕𝗮𝘀𝗲𝗱 𝗚𝗮𝗶𝗻𝘀 𝗔𝗺𝗶𝗱 𝗦𝗲𝗰𝘁𝗼𝗿 𝗥𝗼𝘁𝗮𝘁𝗶𝗼𝗻 Indian markets ended May on a steady note. While the Nifty 50 (-0.41%) and Sensex (-0.33%) saw mild declines, the Nifty 50 Equal Weight rose +1.12%, showing broader participation. Midcap (+1.4%) and Smallcap (+2.1%) segments led gains, with the Midcap index up +18.9% over 3 months. However, Nifty Next 50 fell -0.50% this week and is down -7.9% over six months, reflecting weakness in select largecaps. ________________________________________ 𝟮. 𝗦𝘁𝘆𝗹𝗲 & 𝗙𝗮𝗰𝘁𝗼𝗿 𝗧𝗿𝗲𝗻𝗱𝘀: 𝗔𝗹𝗽𝗵𝗮 𝗮𝗻𝗱 𝗠𝗼𝗺𝗲𝗻𝘁𝘂𝗺 𝗟𝗲𝗮𝗱 𝗙𝗮𝗰𝘁𝗼𝗿 𝘀𝘁𝗿𝗮𝘁𝗲𝗴𝗶𝗲𝘀 𝗿𝗲𝗯𝗼𝘂𝗻𝗱𝗲𝗱: • Nifty Alpha 50 rose +2.7% this week and +7.1% over a month. • Momentum gained +1.3% WoW, though remains -6.9% YTD—highlighting ongoing volatility. ________________________________________ 𝟯. 𝗙𝗶𝘅𝗲𝗱 𝗜𝗻𝗰𝗼𝗺𝗲: 𝗬𝗶𝗲𝗹𝗱𝘀 𝗗𝗿𝗼𝗽 𝗼𝗻 𝗗𝗶𝘀𝗶𝗻𝗳𝗹𝗮𝘁𝗶𝗼𝗻 𝗕𝗼𝗻𝗱 𝘆𝗶𝗲𝗹𝗱𝘀 𝗳𝗲𝗹𝗹 𝘀𝗵𝗮𝗿𝗽𝗹𝘆: • 6M T-bill yield dropped 41 bps MoM to 5.59% • 10Y GoI yield at 6.22% (down 63.4 bps over 6M) • CPI eased to 3.16% in April from 4.31% in January, boosting rate cut hopes. ________________________________________ 𝟰. 𝗚𝗹𝗼𝗯𝗮𝗹 𝗠𝗮𝗿𝗸𝗲𝘁𝘀: 𝗧𝗲𝗰𝗵 𝗦𝘁𝗿𝗲𝗻𝗴𝘁𝗵 𝗶𝗻 𝗨.𝗦., 𝗘𝘂𝗿𝗼𝗽𝗲 𝗟𝗮𝗴𝘀 • U.S. indices gained: S&P 500 (+1.2%), Nasdaq 100 (+1.3%) on strong AI earnings and soft inflation (2.16%). • Europe weakened: DAX (-0.3%), CAC 40 (-1.1%) amid mixed data. • Nikkei rebounded +2.1%; Hang Seng fell -1.6% as China stimulus momentum faded. ________________________________________ 𝟱. 𝗖𝘂𝗿𝗿𝗲𝗻𝗰𝘆 & 𝗖𝗼𝗺𝗺𝗼𝗱𝗶𝘁𝗶𝗲𝘀: 𝗜𝗡𝗥 𝗦𝘁𝗮𝗯𝗹𝗲, 𝗚𝗼𝗹𝗱 𝗘𝗮𝘀𝗲𝘀 • USD/INR at ₹85.57, stable amid FII flows. • Gold dipped -1.4% WoW, but remains +24.2% YTD. • Brent crude at $63.99, pressured by demand concerns and rising inventories. ________________________________________ 𝟲. 𝗠𝗮𝗰𝗿𝗼 𝗕𝗮𝗰𝗸𝗱𝗿𝗼𝗽: 𝗖𝗼𝗼𝗹𝗶𝗻𝗴 𝗜𝗻𝗳𝗹𝗮𝘁𝗶𝗼𝗻, 𝗠𝗶𝘅𝗲𝗱 𝗚𝗿𝗼𝘄𝘁𝗵 𝗦𝗶𝗴𝗻𝗮𝗹𝘀 • India’s CPI at 3.16% in April provides RBI policy room. • Global focus remains on U.S. PCE inflation and Fed’s next move. • Diverging global macro trends continue—India and U.S. showing resilience. Until next time, Bye
We are excited to announce that our co-founder, Ravi Saraogi, will be speaking at NISM’s June Investor Education Webinar Series! 📢 𝗧𝗼𝗽𝗶𝗰: Factor-Based Analysis for Mutual Funds in India – A Practical Approach for Smarter Investing 🗓️ 𝗗𝗮𝘁𝗲: Tuesday, 24th June 2025 🕓 𝗧𝗶𝗺𝗲: 4:00 – 5:00 PM IST 🔗 𝗥𝗲𝗴𝗶𝘀𝘁𝗲𝗿 𝗵𝗲𝗿𝗲: https://zoom.us/webinar/register/WN_ouMAp8QTR_2x-dCKfoQByA#/registration Factor-based analysis is a robust global framework for evaluating investment strategies—yet its application in the Indian mutual fund landscape remains limited. This webinar brings factor-based analysis into focus for Indian investors through a practical, hands-on approach. The session will highlight how investors can move beyond traditional metrics like past returns and star ratings to make more informed fund choices. #MutualFunds #FactorInvesting #NISM #InvestorEducation #SmartInvesting #SamasthitiAdvisors #Webinar

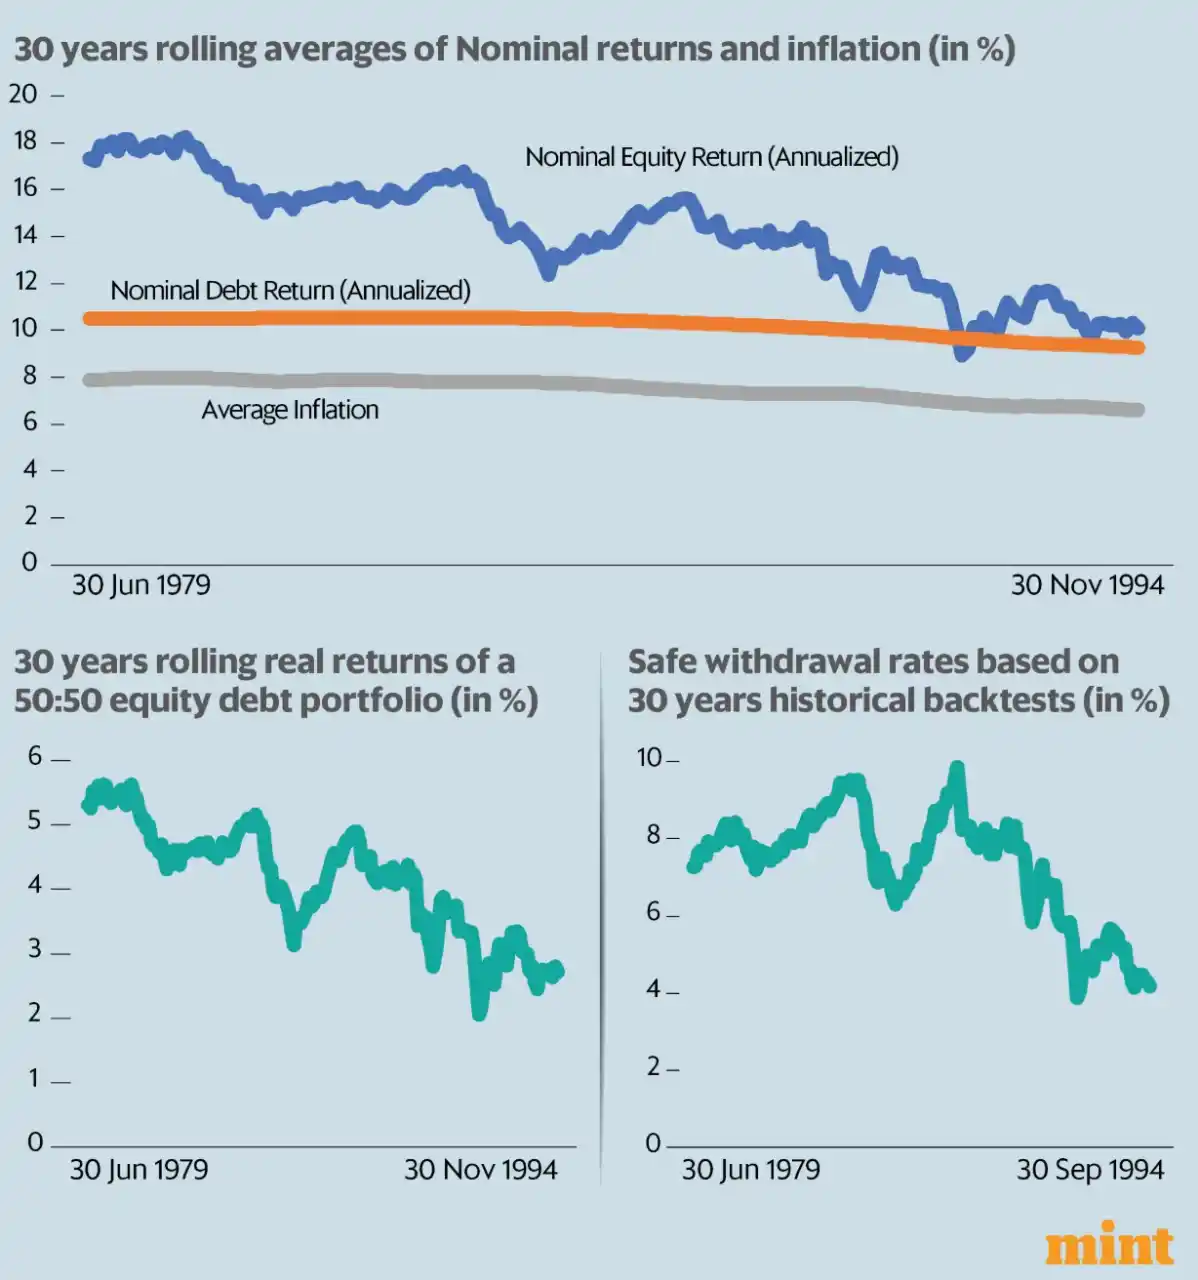
🎉 𝗘𝘅𝗰𝗶𝘁𝗶𝗻𝗴 𝗡𝗲𝘄𝘀 – 𝗢𝘂𝗿 𝗖𝗼-𝗔𝘂𝘁𝗵𝗼𝗿𝗲𝗱 𝗥𝗲𝘀𝗲𝗮𝗿𝗰𝗵 𝗪𝗶𝗻𝘀 𝗙𝗶𝗿𝘀𝘁 𝗣𝗿𝗶𝘇𝗲 𝗮𝘁 𝗜𝗥𝗖𝗣 𝟮𝟬𝟮𝟱 𝗳𝗼𝗿 𝗥𝗲𝘀𝗲𝗮𝗿𝗰𝗵 𝗼𝗻 𝗦𝗮𝗳𝗲 𝗪𝗶𝘁𝗵𝗱𝗿𝗮𝘄𝗮𝗹 𝗥𝗮𝘁𝗲𝘀 𝗶𝗻 𝗜𝗻𝗱𝗶𝗮 Our co-authored paper with Rajan Raju, “Balancing Acts: Safe Withdrawal Rates in the Indian Context”, won 𝗙𝗶𝗿𝘀𝘁 𝗣𝗿𝗶𝘇𝗲 at the 𝟭𝘀𝘁 𝗜𝗻𝘁𝗲𝗿𝗻𝗮𝘁𝗶𝗼𝗻𝗮𝗹 𝗥𝗲𝘀𝗲𝗮𝗿𝗰𝗵 𝗖𝗼𝗻𝗳𝗲𝗿𝗲𝗻𝗰𝗲 𝗼𝗻 𝗣𝗲𝗻𝘀𝗶𝗼𝗻 (𝗜𝗥𝗖𝗣 𝟮𝟬𝟮𝟱), hosted by 𝗣𝗙𝗥𝗗𝗔 in April 2025. 𝗥𝗲𝗮𝗱 𝘁𝗵𝗲 𝗽𝗿𝗲𝘀𝘀 𝗿𝗲𝗹𝗲𝗮𝘀𝗲 𝗵𝗲𝗿𝗲: https://www.pib.gov.in/PressReleasePage.aspx?PRID=2119157. The paper examines how much Indian retirees can safely withdraw each year from their portfolios, offering an India-specific alternative to the 4% rule, based on local inflation and asset return data. 𝗧𝗵𝗶𝘀 𝗿𝗲𝗰𝗼𝗴𝗻𝗶𝘁𝗶𝗼𝗻 𝗿𝗲𝗶𝗻𝗳𝗼𝗿𝗰𝗲𝘀 𝗦𝗮𝗺𝗮𝘀𝘁𝗵𝗶𝘁𝗶’𝘀 𝗺𝗶𝘀𝘀𝗶𝗼𝗻 𝘁𝗼: ✅ Promote research on social security in India ✅ Make retirement planning informed, practical, and accessible We are grateful to the jury, co-authors, and the incredible community of researchers and regulators who made IRCP 2025 such a meaningful event.

*What can Indian retirees learn from history? Perhaps, not much.* Our research shows that safe withdrawal rates based on India’s historical data—though they may appear generous—could lead future retirees into a false sense of security. I walk through the data, trends in real returns, and simulation-based approaches in this *Mint* article. The conclusion is clear: a 4% withdrawal rate is too optimistic for India. A 3–3.5% range is more realistic. Read below 👇 https://www.livemint.com/money/personal-finance/why-historical-data-on-withdrawal-rate-misleads-indian-retirees-11748751509748.html Extended Version here - https://samasthiti.in/why-history-misleads-indian-retirees/
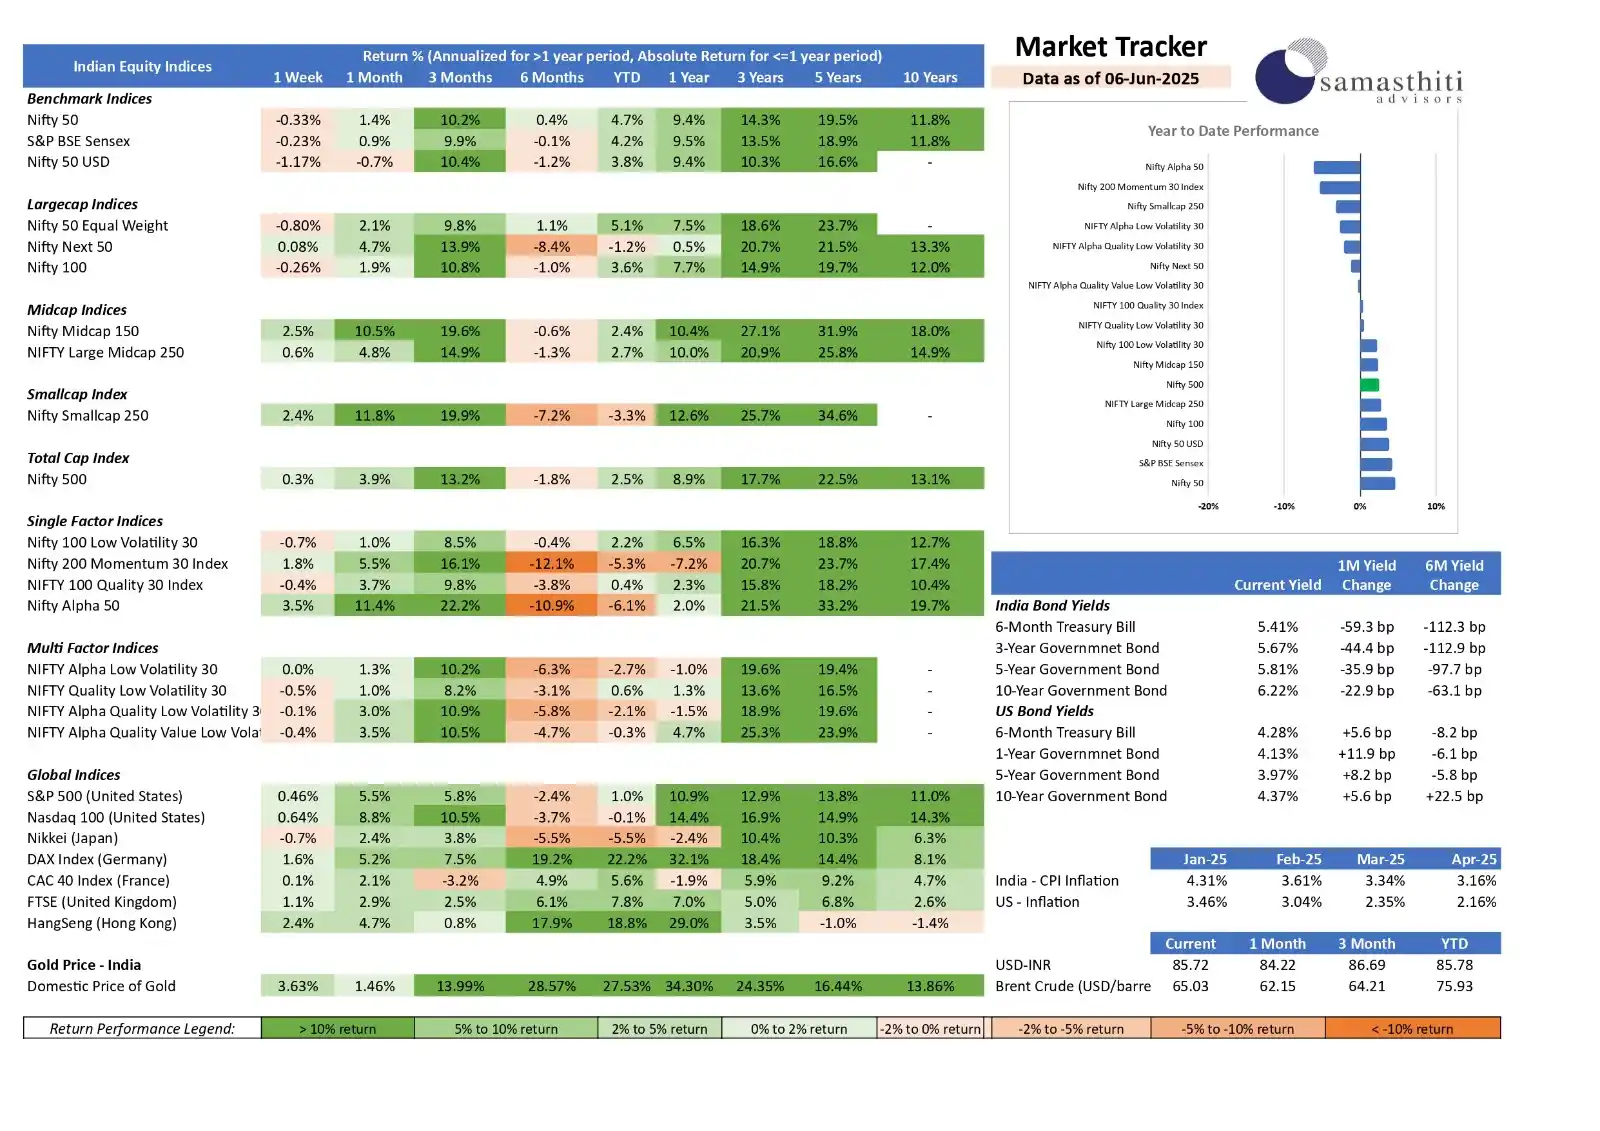
𝗦𝗮𝗺𝗮𝘀𝘁𝗵𝗶𝘁𝗶 𝗔𝗱𝘃𝗶𝘀𝗼𝗿’𝘀 𝗪𝗲𝗲𝗸𝗹𝘆 𝗠𝗮𝗿𝗸𝗲𝘁 𝗧𝗿𝗮𝗰𝗸𝗲𝗿 – 𝗙𝗼𝗿 𝘁𝗵𝗲 𝘄𝗲𝗲𝗸 𝗲𝗻𝗱𝗲𝗱 *June 6,* 𝟮𝟬𝟮𝟱 *1. Indian Equities – Mid- & Small-caps steal the show* * *Headline indices were subdued,* with the Nifty 50 and Sensex ending slightly in the red. This masked a much stronger undertone in the broader market, where investor risk appetite clearly picked up. * *Midcaps and smallcaps outperformed sharply* , with gains of over 2% for the week. These segments benefitted from strong earnings momentum, renewed interest from domestic institutional investors, and improving sentiment toward India's capex cycle. * *The RBI’s surprise 50 bps rate cu* t was the week's most important event. By bringing the repo rate down to 5.50%, the central bank signalled a decisive shift to supporting growth. The rationale cited was a sharp decline in headline inflation to 3.2%, coupled with subdued private investment activity. * *Markets cheered the move* , especially sectors sensitive to interest rates—such as financials, real estate, and discretionary consumption. The Nifty closed the week above the psychological 25,000 mark, despite a muted start. *2.Factors & Styles – Alpha roars back* * *High-beta and alpha-driven strategies bounced back strongly*, suggesting that investors are now willing to take on more risk. The Nifty Alpha 50 index gained 3.5% for the week and is up over 11% in the past month—reversing prior underperformance. * *Momentum strategies also performed well* , supported by a sharp rally in recently trending mid- and smallcap names. Investors appeared more comfortable leaning into past winners in an environment where macro conditions are turning more supportive. * *Defensive strategies—like low-volatility and quality indices—lagged,* as markets rotated away from safety. This shift is typical in early easing cycles, where investors begin to favour higher-growth and higher-risk names. *3. Fixed Income – Bull-steepening continues* * *Bond yields fell across the curve* , with the 10-year government bond yield easing to 6.22% and short-term yields declining even more sharply. The 6-month T-bill yield, for example, dropped to 5.41%. * *The yield curve is steepening,* reflecting abundant liquidity at the short end and expectations of further easing by the RBI. This pattern—known as a bull steepening—is favourable for bondholders, especially those positioned in medium-duration segments. * *Investor interest remains high* in 3–5 year government securities, which offer a sweet spot between yield and duration risk. With inflation under control and the central bank turning dovish, bonds may continue to deliver steady returns. *4. Global Backdrop – Central-bank divergence widens* * *U.S. equities posted modest gains* , with the S&P 500 and Nasdaq 100 both inching higher. However, the tone from the Federal Reserve remained cautious. Sticky inflation and higher import tariffs continue to challenge the case for near-term rate cuts. * *Bond yields in the U.S. edged up,* with the 10-year Treasury yield rising to 4.37%. This stands in contrast to India’s falling yield trend, widening the interest rate differential between the two economies. * *European equities performed better,* led by the DAX, as investor expectations firmed around a potential rate cut by the ECB in the coming quarter. Growth data in the Eurozone showed some early signs of bottoming. * *Asian markets were mixed* , but Hong Kong stood out. The Hang Seng Index rose 2.4%, helped by continued policy support from Chinese authorities aimed at stabilising the real estate market and improving consumer confidence. *5. Commodities & FX – Gold regains shine; oil under pressure* * *Gold prices in India rose sharply* , gaining 3.6% over the week and taking year-to-date gains past 27%. Investors continue to seek refuge in gold amid geopolitical risks and diverging global policy narratives. * *Oil prices drifted lower,* with Brent crude falling 1.6% to below $65/barrel. Sentiment weakened on concerns about excess U.S. fuel inventories and speculation that OPEC+ could raise output to protect market share, despite slowing demand. * *The rupee depreciated slightly* , ending the week at ₹85.72 against the dollar. The weakness was primarily driven by the growing policy gap between the Fed (on hold) and the RBI (now easing). However, healthy equity inflows helped cap further downside. 𝗨𝗻𝘁𝗶𝗹 𝗻𝗲𝘅𝘁 𝘁𝗶𝗺𝗲, 👋 𝗯𝘆𝗲! 🌟
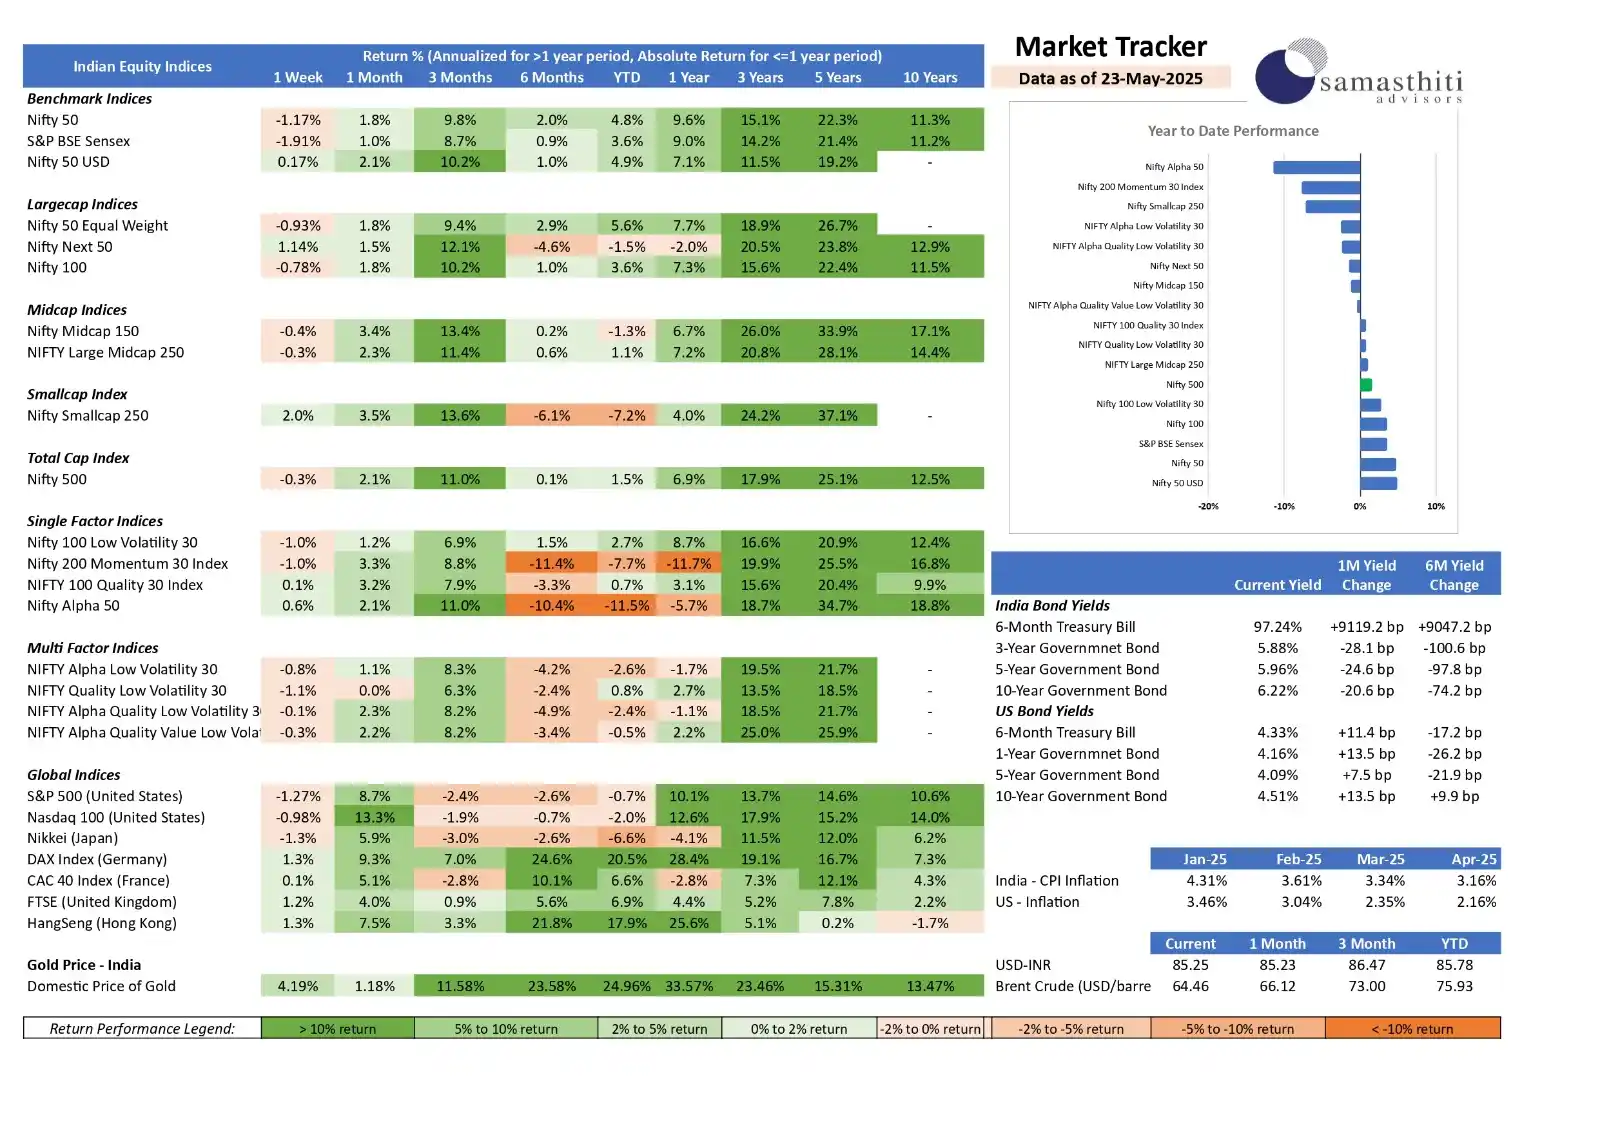
𝗦𝗮𝗺𝗮𝘀𝘁𝗵𝗶𝘁𝗶 𝗔𝗱𝘃𝗶𝘀𝗼𝗿’𝘀 𝗪𝗲𝗲𝗸𝗹𝘆 𝗠𝗮𝗿𝗸𝗲𝘁 𝗧𝗿𝗮𝗰𝗸𝗲𝗿 – 𝗙𝗼𝗿 𝘁𝗵𝗲 𝘄𝗲𝗲𝗸 𝗲𝗻𝗱𝗲𝗱 𝗠𝗮𝘆 𝟮𝟯, 𝟮𝟬𝟮𝟱 𝟭. 𝗜𝗻𝗱𝗶𝗮𝗻 𝗘𝗾𝘂𝗶𝘁𝗶𝗲𝘀: 𝗠𝗮𝗿𝗸𝗲𝘁𝘀 𝗧𝗮𝗸𝗲 𝗮 𝗕𝗿𝗲𝗮𝘁𝗵𝗲𝗿 𝗔𝗺𝗶𝗱 𝗥𝗼𝘁𝗮𝘁𝗶𝗼𝗻 𝗮𝗻𝗱 𝗚𝗹𝗼𝗯𝗮𝗹 𝗨𝗻𝗰𝗲𝗿𝘁𝗮𝗶𝗻𝘁𝘆 Indian markets paused this week amid global caution and sectoral rotation. 𝗡𝗶𝗳𝘁𝘆 𝟱𝟬: -𝟭.𝟭𝟳% | 𝗦𝗲𝗻𝘀𝗲𝘅: -𝟭.𝟵𝟭% – profit booking after a strong run. 🔎Beneath the surface, broader markets showed strength: • 𝗠𝗶𝗱 & 𝗟𝗮𝗿𝗴𝗲 𝗠𝗶𝗱𝗰𝗮𝗽𝘀: Held steady, maintaining long-term leadership • 𝗦𝗺𝗮𝗹𝗹𝗰𝗮𝗽𝘀: Surprised with +2.0% WoW, topping 1Y returns at +24.2% • 𝗡𝗶𝗳𝘁𝘆 𝗡𝗲𝘅𝘁 𝟱𝟬: Rebounded +1.14%, still -1.5% YTD Investors continue to favor growth-oriented and domestic themes, even as frontline indices cool off. ________________________________________ 𝟮. 𝗦𝘁𝘆𝗹𝗲 & 𝗙𝗮𝗰𝘁𝗼𝗿 𝗜𝗻𝗱𝗶𝗰𝗲𝘀: 𝗩𝗼𝗹𝗮𝘁𝗶𝗹𝗶𝘁𝘆 𝗪𝗲𝗶𝗴𝗵𝘀 𝗼𝗻 𝗛𝗶𝗴𝗵 𝗕𝗲𝘁𝗮, 𝗔𝗹𝗽𝗵𝗮 𝗛𝗼𝗹𝗱𝘀 𝗦𝘁𝗲𝗮𝗱𝘆 Volatility continues to weigh on high-beta strategies • 𝗠𝗼𝗺𝗲𝗻𝘁𝘂𝗺 (-𝟭.𝟬%) 𝗮𝗻𝗱 𝗤𝘂𝗮𝗹𝗶𝘁𝘆 (+𝟬.𝟭%) were flat to weak • 𝗟𝗼𝘄 𝗩𝗼𝗹𝗮𝘁𝗶𝗹𝗶𝘁𝘆 offered modest downside protection • 𝗔𝗹𝗽𝗵𝗮 𝟱𝟬 stood out with +0.6%, despite being -11.5% YTD, hinting at selective stock strength Multi-factor indices remained muted, suggesting a more balanced, risk-aware approach is prudent in the current environment. ________________________________________ 𝟯. 𝗙𝗶𝘅𝗲𝗱 𝗜𝗻𝗰𝗼𝗺𝗲: 𝗕𝗼𝗻𝗱 𝗬𝗶𝗲𝗹𝗱𝘀 𝗦𝗹𝗶𝗱𝗲 𝗮𝘀 𝗗𝗶𝘀𝗶𝗻𝗳𝗹𝗮𝘁𝗶𝗼𝗻 𝗖𝗼𝗻𝘁𝗶𝗻𝘂𝗲𝘀 📉 Bond yields continued to slide as disinflation held steady • 𝟭𝟬𝗬 𝗚-𝘀𝗲𝗰 dropped to 6.22% (↓74 bps in 6M) • 𝟯𝗬 𝘆𝗶𝗲𝗹𝗱 fell sharply to 5.88% (↓100.6 bps) 📊 Yield curve flattening signals growing expectations of RBI policy easing later in FY26, reinforced by falling CPI (3.16%) and negative WPI. ________________________________________ 𝟰. 𝗚𝗹𝗼𝗯𝗮𝗹 𝗠𝗮𝗿𝗸𝗲𝘁𝘀: 𝗠𝗶𝘅𝗲𝗱 𝗣𝗶𝗰𝘁𝘂𝗿𝗲 𝗔𝗺𝗶𝗱 𝗙𝗲𝗱 𝗪𝗮𝘁𝗰𝗵 𝗮𝗻𝗱 𝗣𝗼𝗹𝗶𝗰𝘆 𝗗𝗶𝘃𝗲𝗿𝗴𝗲𝗻𝗰𝗲 Global markets saw mixed action this week • 𝗦&𝗣 𝟱𝟬𝟬 (-𝟭.𝟮𝟳%) & 𝗡𝗮𝘀𝗱𝗮𝗾 𝟭𝟬𝟬 (-𝟬.𝟵𝟴%) dipped on hawkish Fed signals • 𝗛𝗮𝗻𝗴 𝗦𝗲𝗻𝗴 extended gains (+1.3% WoW, +25.6% 1Y) on continued policy support from China Global leadership is shifting toward value and EM-friendly regions, driven by optimism around stimulus and easing inflation (US CPI: 2.16%). ________________________________________ 5. 𝗖𝘂𝗿𝗿𝗲𝗻𝗰𝘆 & 𝗖𝗼𝗺𝗺𝗼𝗱𝗶𝘁𝗶𝗲𝘀: 𝗜𝗡𝗥 𝗦𝘁𝗲𝗮𝗱𝘆, 𝗚𝗼𝗹𝗱 𝗖𝗼𝗻𝘁𝗶𝗻𝘂𝗲𝘀 𝘁𝗼 𝗦𝗵𝗶𝗻𝗲 💱 𝗜𝗡𝗥 held steady at ₹85.25/USD, supported by strong FPI inflows and a narrowing current account deficit. 🪙 𝗚𝗼𝗹𝗱 continued its rally (+4.19% WoW, +33.57% YoY), driven by safe-haven demand and central bank buying. 🛢️ 𝗕𝗿𝗲𝗻𝘁 𝗖𝗿𝘂𝗱𝗲 stayed range-bound near $83, as global demand worries offset geopolitical tensions. 𝗨𝗻𝘁𝗶𝗹 𝗻𝗲𝘅𝘁 𝘁𝗶𝗺𝗲, 👋 𝗯𝘆𝗲! 🌟